


Talking Points:
- Why Use Price Targets
- Price Targets on 1-Box vs. 3-Box P&F Charts
- What Targets Should You Ignore?
“Wishful thinking must be banished.”
“I did precisely the wrong thing. The cotton showed me a loss and I kept it. The wheat showed me a profit and I sold it out. Of all the speculative blunders there are few greater than trying to average a losing game. Always sell what shows you a loss and keep what shows you a profit.”
-Jesse Livermore
One of the first mistakes that traders fall prey to based on their own faulty thinking is exiting good trades too soon. If this was the only problem, traders wouldn’t be so bad off but the other thing we’ve found is that traders also hold on to losing traders longing their winners hoping they eventually come back. The bad trades all too often don’t come back and traders are forced out of their bad trades at bad prices instead of deciding when to get out of them
(If you’re curious to know what we found to be the common characteristics of the best traders over 1 year of live trading data, check out our free guide here.)
Why Use Price Targets?

If you identified with the problem mentioned in the opening paragraph of holding on to losers too long, do not lose hope. There are a few reasons why traders can do much harm to their account equity by holding onto traders too long:
- Trader’s don’t know exactly what they’re trying to get out of the market
- Trader’s don’t want to admit that their analysis was wrong
- Trader’s don’t have firm points of ruin where they see the trade as no longer worth it
To help you attack the first reason why traders hold on to loosing trades, it may be helpful for you to learn how to do P & F price projections. While note a panacea, Point & Figure ‘counts’, can help you to hold on to a profitable trade to either squeeze more out of your good entry or at least bring your stop to break even so that you are at least limiting your risk. Last week, you learned that the two most common types of P&F charts are 1-box & 3-box charts and today you will learn how to create price targets on both charts from both horizontal and vertical price action.
Price Targets on 1-Box vs. 3-Box P&F Charts
Ideally, Point & Figure charts should be added to your current analysis routine while not replacing your trading charts and also allow you to see from a glance how strong a trend is or how stubborn a price range is. Also, 1-Box & 3-Box P&F charts should be utilized in tandem as they complement each other more so than compete against each other. The first price target we will look at are horizontal counts from a congestion breakout on the more active, 1-box charts:
Step 1: Identify an Area of Congestion on 1-Box Charts
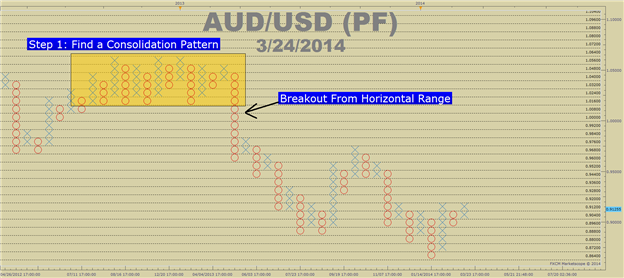
Courtesy of Marketscope 2.0
Step 2: Identify How Many Columns Occupy the Range
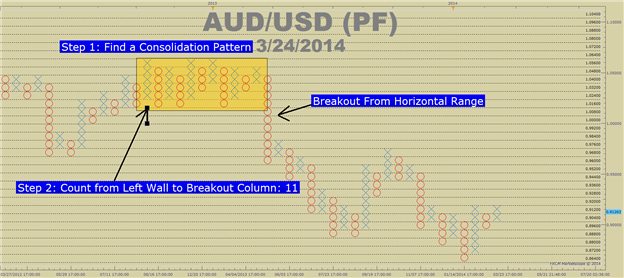
Courtesy of Marketscope 2.0
Step 3: Project Target from the Breakout Direction (Congestion X Box Reversal)
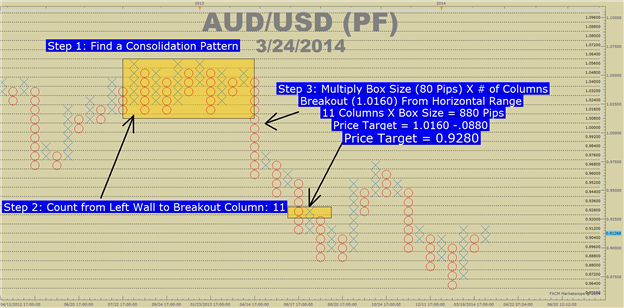
Courtesy of Marketscope 2.0
While it may look difficult at first glance, it’s actually quite easy. Here are the steps again:
- Identify an area of congestion on your 1-box reversal Point & Figure charts like seen on AUDUSD
- Count the number of columns occupied in your Point & Figure prior to breakout (ex. 11)
- I look for the point at which price stops progress to the following breakout
- Develop a pip count projection by multiplying box reversal size (1ATR) by # of columns (ex. 11)
- Project the pip amount from the breakout for your price target: 1.0160 – 0.0880 pips: 0.9280
3-Box Counts
The purpose of Point & Figure charts was to allow you to get a clear understanding of what is happening in terms of overall trend without being a slave to the charts. Before computers and real-time charts, investors could simply pull the high or low on the day and use that data to compile their own P&F charts. The 3-box are seen as less subjective however, because so much price action is lost in the 3-box charts, I prefer the 1-box counts price projections over the 3-box but both can be helpful.
Point & Figure Price Projections on 3-Box Reversals (Same Idea as 1-Box)
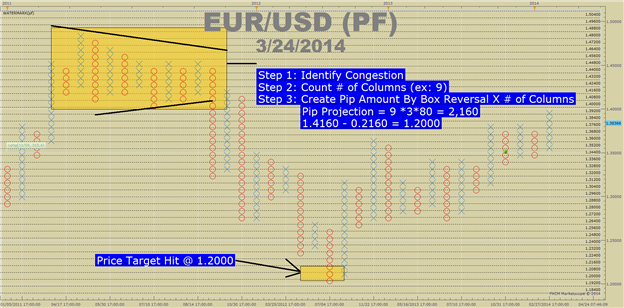
Courtesy of Marketscope 2.0
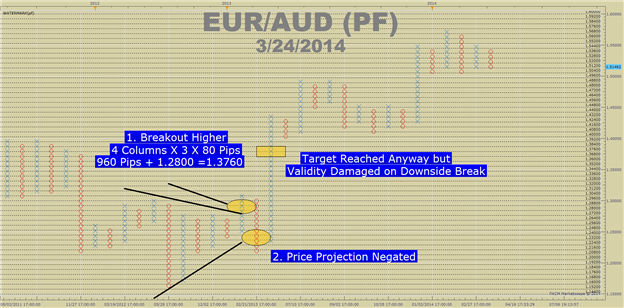
Before you count every consolidation, there are a handful of rules that as to what price action should precede a congestion pattern worth counting a price projection from. The key things to look for are a strong prior trend that runs out of steam which we had from 2009-2001, a topping pattern when you can see from the triangle, and finally, a turn in the trend as the congestion sees a breakout. You’ll notice above that the price target of 1.2000 hit nicely in due time but please note that P&F price projections are not guarantees of future price action.
What Targets Should You Ignore?
You should note that not all counts will be achieved. Many traders to this day will have multiple counts where they will take money off the table when targets are met along the way. Once a count is negated, it’s best to ignore the targets that you calculated. You can consider a count negated when price move or reverses beyond the column that the price projection started from.
Learn When to Retire Price Projections
Happy Trading!
Point & Figure Introduction – I of IV
Point & Figure – 1 & 3-Box Reversal Charts – II of IV
---Written by Tyler Yell, Trading Instructor
To contact Tyler, email tyell@dailyfx.com
To be added to Tyler’s e-mail distribution list, please click here
Tyler is available on Twitter @ForexYell
Become a Smarter Trader Today
Claim your FREE universal membership to DailyFX Internet Courses & save yourself hours in figuring out what FOREX trading is all about.
You'll get this FREE 20 minute “New to FX” course presented by DailyFX Education. In the course, you will learn about the basics of a FOREX transaction, what leverage is, and how to determine an appropriate amount of leverage for your trading.


