


Talking Points:
- Forex traders use Fibonacci support and resistance levels to buy o the dip
- The 38.2%, 50%, and 61.8% Fibonacci levels are where price typically rebounds
- The EURGBP is has recently rebounded from an area of significant Fibonacci support
If you have been trading for any length of time, you have undoubtedly seen the big Forex move that got away. There is a feeling of regret that you missed the move. In addition, there is the fear that price would reverse as soon as you were to get into the trade.
So how can Forex traders time their entries and enter with a degree of confidence? The answer is to use Fibonacci retracements to buy the “rebound.”
Learn Forex: EURGBP Rebound from 61.8% Fibonacci Level
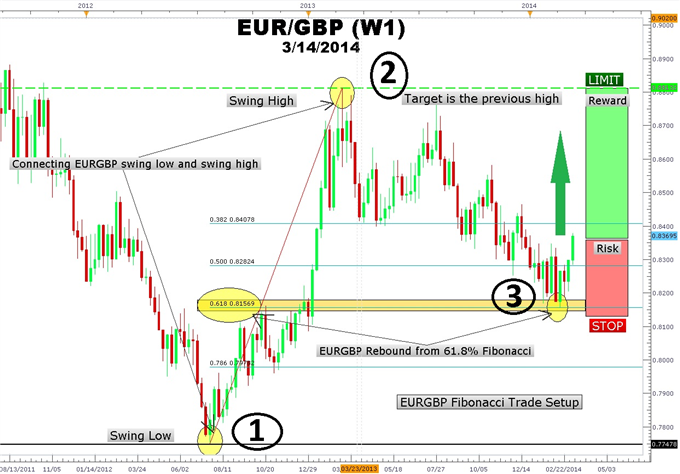
Created by Marketscope 2.0
In the above chart of EURGBP, price surged 1059 pips from the low of 0.7747 on July 21st 2002 to the 0.8813 high on February 23rd 2013. It was an amazing climb especially in late December where EURGBP began to accelerate in four wide ranging green candles.
If you missed this move, don’t worry because Fibonacci retracements can be used to identify key levels of support where price may resume the uptrend. Typical rebound areas are the 38%, 50%, and 61.8% levels.
Three Step Fibonacci Trade Setup
- Start the Fibonacci tool at the beginning of the impulse move.
- Use the Fibonacci tool to connect the highest point of the move.
- Buy after price rebounds from a Fibonacci level.
Additionally, you would place a stop just below the swing low and take profit point at the previous high. Once price moves in your favor, move stop to breakeven at earliest opportunity. Usually, a protective stop can be moved once a new candle has opened up above the entry.
As you can see from the chart, there were a few false starts as EURGBP pulled back to a Fibonacci level rebounded higher for a few hundred pips and then broke back down below that same Fibonacci level. There is a possibility that this current rebound from the 0.8156 61.8% Fibonacci area could also end up pulling back and breaking down to the next Fibonacci level.
The key is to remain flexible and lock in profits along the way ahead of the bigger target. GBP weakness and the current stretch of Euro strength could power EURGBP higher. Whether Fibonacci levels are self-fulfilling prophecies or linked to some other phenomenon, it is important for traders to recognize these levels as potential areas to catch the “second act” of a bull run!
---Written by Gregory McLeod, Trading Instructor
This article showed you how to use Fibonacci to trade EURGBP bounce. I want to invite you to enroll in our free Fibonacci Retracement Course to further your understanding of Fibonacci. Sign our Guestbook to gain access to this course. You will automatically have universal access to other courses.


