


Developed by George C. Lane in the late 1950s, the Stochastic Oscillator is a momentum indicator that shows the location of the current close relative to the high/low range over a certain number of periods.
New traders typically want to know the difference between Fast Stochastics and Slow Stochastics. They also want to know whether the typical default settings of 5,5 (Fast Stochastics) or 5,5,5 (Slow Stochastics) as seen in most charting packages developed for FX are better or worse than the typical default settings of 14,3 (Fast Stochastics) or 14,3,3 (Slow Stochastics) seen in stock and futures charting packages.
First of all, the difference between Fast Stochastics and Slow Stochastics is just a moving average.
When calculating Fast Stochastics using the values of 5 and 5, the first “5” is the raw value for Stochastics, while the second “5” is a 5-period moving average of the first “5”. When using Slow Stochastics, the first two 5’s are the same as with the Fast Stochastics, with the third “5” being a moving average of the second “5”. Yes, that’s right, a moving average of the moving average. This slows the movement of the indicator down even further, hence the name of Slow Stochastics.
By slowing the movement of the indicator down, we will see fewer signals to buy or sell on the chart, but they should be more reliable signals. By using a larger value in calculating the raw value of Stochastics, we slow the indicator down even more. This is why I recommend to traders using FX charts to use the Slow Stochastics with values of 15,5,5. This combination offers fairly reliable signals that can offer solid entries into trading opportunities. The chart below shows the difference between Fast Stochastics with values of 5,5 compared to Slow Stochastics with values of 15,5,5.
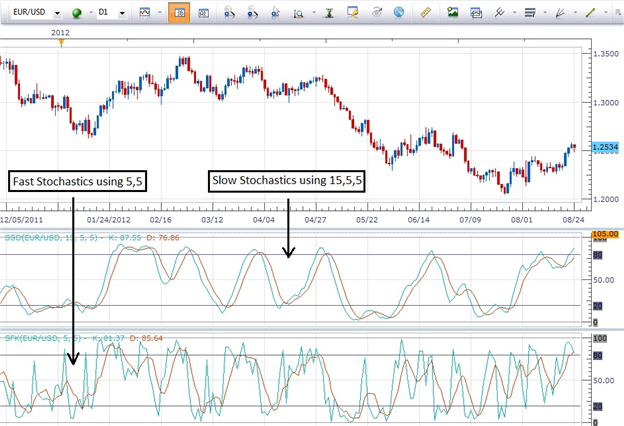
You can see how much easier it is to identify the signals using the Slow Stochastics. Being able to use the technical tool effectively is most of the battle. By keeping things simple and consistent, we should start to see consistent results in our trading.
As with all indicators, entering a trade only when the indicator generates an entry that is in the direction of the trend can result in a higher probability of success.
Interested In Our Analyst's Best Views On Major Markets? Check Out Our Free Trading Guides Here


