


While most traders will acknowledge that trading in the direction of the longer term trend is the higher probability way of trading, there are some traders who are looking to trade a currency pair as it retraces or pulls back from its overall trend. It is for these traders that this piece is written.
Generally speaking, after a currency pair has made a strong move over an extended period of time in one direction, a retracement is likely to take place. The stronger and longer the move in the direction of the trend is, the stronger the pullback is likely to be. (As is the case with virtually everything in trading, there are absolutely no guarantees.)
Let’s take a look at the Daily chart of the AUDJPY pair below…
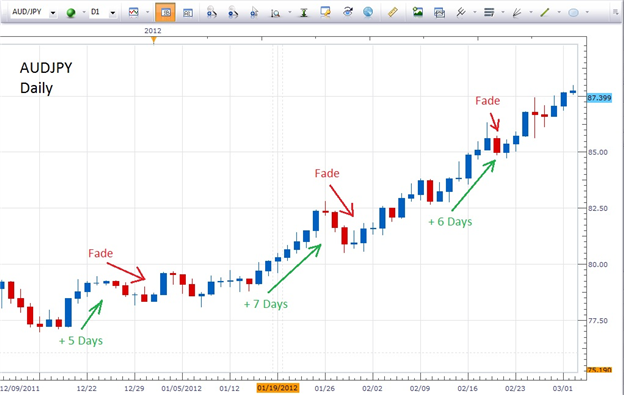
On this chart we have three examples of “fading the move”. The first is based on a 5 day move to the upside which continued for 230 pips and the retracement moved 110 pips in the opposite direction. The second is a 7 day bullish move of 380 pips with a retracement of 220 pips. The last example is a 6 day bullish move of 360 pips with a retracment of about 85 pips.
You can see that after each strong move in the direction of the trend, there is a retracement or consolidation. “Fading the move” means that a trader will wait for the move to the upside to stall. This stall may take place at a level of Support or Resistance or a Fib level for example.
It can further be identified by the types of candlesticks that form at the point of the stall. A trader would be looking for dojis, long wicks or bullish reversal candle patterns along the level of support that is forming.
Once that stall occurs, the trader then will “fade” that move. In other words, they will open a trade in the opposite direction of the original move…they would be selling or fading the AUDJPY in this case.
Oftentimes the “Fade the Move” strategy is employed by fundamental traders on a shorter time frame chart after a news announcement strongly moves a currency pair in one direction or the other. The thought process is that after that initial surge or spike in the price, the pullback/retracement will occur and they can “fade the move”.
Bear in mind, however, that when trading against the prevailing trend whether on a longer or shorter term chart, a trader is taking on additional risk.
To demonstrate this point, one thing that is immediately noticeable from our examples on the AUDJPY chart, is that there is really no correlation between the strength or duration of the move and the amount of the retracement.
This is a major challenge when trading against the trend: the longer term trend may return at any time.
Lastly, if a trader were using this strategy in a downtrend, the trader wait for the pair to stall in its move to the downside and they would then fade the move by buying the pair.


