


In an earlier article about employing the Fibonacci Tool in your trading, the basics of its use were covered. In this follow-up, I would like to go into more detail about what to look for as the pair “stalls” at one of the Fib levels.
For this article, let’s use the current 1 hour chart of the GBPJPY currency pair below…
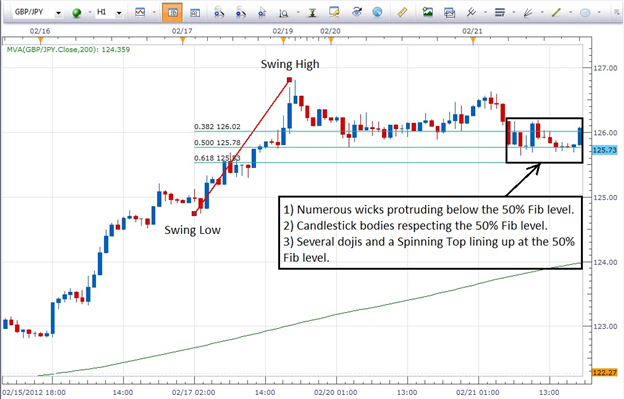
Since this pair is in an uptrend on the daily chart and on the 4 hour chart as well, I know that I only want to buy the pair and I am merely looking for a technical reason to do so. Bringing up the 1 hour chart and noticing that the pair is “stalling” at a support level around 125.76, I draw a Fib line from a recent Swing Low (noted on the chart) to the Swing High of the move…also noted on the chart. After having done that, it becomes apparent that price is stalling at the 50% Fib level. Looking at how the candles are aligning themselves along that Fib line (see the smaller box on the chart above), there are a couple of things that catch my eye.
There are several wicks that are protruding below this Fib level. This indicates that price has tested the 50% level several time but has not been able to close below it. Based on this we know it is a formidable support level on this 1 hour chart.
Also, looking at the candles themselves we see that there are several Dojis and a Spinning Top. Each of these candles show indecision and potential change in direction.
Putting all this together, an uptrend, a pullback/consolidation at a Fib level and candlesticks that signal a possible change in direction would provide the technical reason that a trader might need to take a long position on the pair.
Using the Fibonacci Tool, a trader could place their stop below the 61.8% Fib level and use a simple 1:2 Risk Reward Ratio for setting their limit on the trade.
Next: Trading Trends with Fibonacci (28 of 50)
Previous: Using the Fibonacci Tool Part I
---Written by Richard Krivo


