


As we consult the charts during our live webinars each day, when “long wicks” present themselves , we definitely take advantage of them in our trading plans.
Let’s take a look at the Daily chart of the USDJPY below for an example…
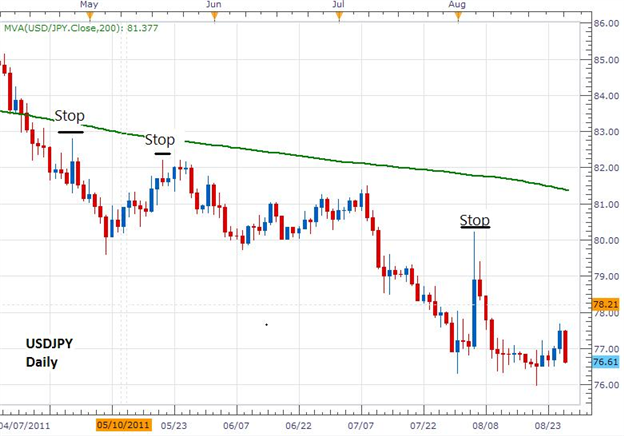
This USDJPY pair is in a downtrend on the Daily chart so we know that we only would be looking for opportunities to short (sell) the pair. That being said, note the three long wicked candles above over which I have placed stops.
A long wick at the top of a candle is created by buyers pushing the price higher and higher. However, the long wick is left behind when the candle closes because the buyers were not able to maintain that high as sellers came in and pushed the price lower.
Ideally, that tells us that a move to the downside may take place since the bulls/buyers could not sustain that move to the upside and the bears/sellers ultimately won out during that time frame. Since price could not be pushed above the top of that wick, it provides an excellent spot to place a stop since price recently tested that level and could not trade above it.
The opposite scenario would be true when a long wick forms at the bottom of a candle.


