


Article Summary: FXCM Trading Volume on the EURJPY has seen an abrupt turn as price broke through resistance after a series of lower highs and lower lows. With SSI showing a greater than 2:1 ratio of short-interest, sentiment traders are favoring upside.
Talking Points:
- EURJPY trading volume is peaking on up days and muted on down days
- A break above the 100-dma was made on bullish volume
- EURJPY SSI has client to -2.08, a bullish signal
It would be a grave mistake to associate the Japanese Yen to only USDJPY. While that pair has been moving sideways for the better part of 2015, other JPY crosses have since broken out progressing off of yen weakness and base currency strength.
This article will look at what these circumstances mean for the pair moving forward.
Retail Sentiment is acquired using DailyFX Plus’ Speculative Sentiment Index. It is free for real FXCM account holders, but is also free for anyone using a two week trial: DailyFX Plus Trial. Most often, SSI will help you see the beginning of a new trend, which is historically fought by the retail trading crowd.
Retail Volume is available on FXCM’s Trading Station Desktop platform. This free software can be downloaded here and a free demo login can be acquired here. Real Volume is a default indicator that can be added to your charts. Volume is used by Institutional FX traders as well as traders from other markets to understand market participation in a move.
EURJPY Volume Favors Upside As Resistance Breaks - Bullish
When we strip down volume based finding a trading edge, we generally look for what direction price is moving when volume is at its highest. The rationale is that the more volume traded during a particular move, the more conviction the move shows. Another way of looking at volume, is that volume helps us see whether or not there is social proof or validation of a move.
The daily chart below shows how the EURJPY broke out of a series of lower highs and lower lows. In fact, over the last month, the three largest volume days or associated on up days from the 126.08 low recorded on April 14, 2015. The price action and volume picture helps to paint a picture of just how bullish the EURJPY may be coming.
Learn Forex: EURJPY Turns Focus On Prior Resistance to Validate Upside
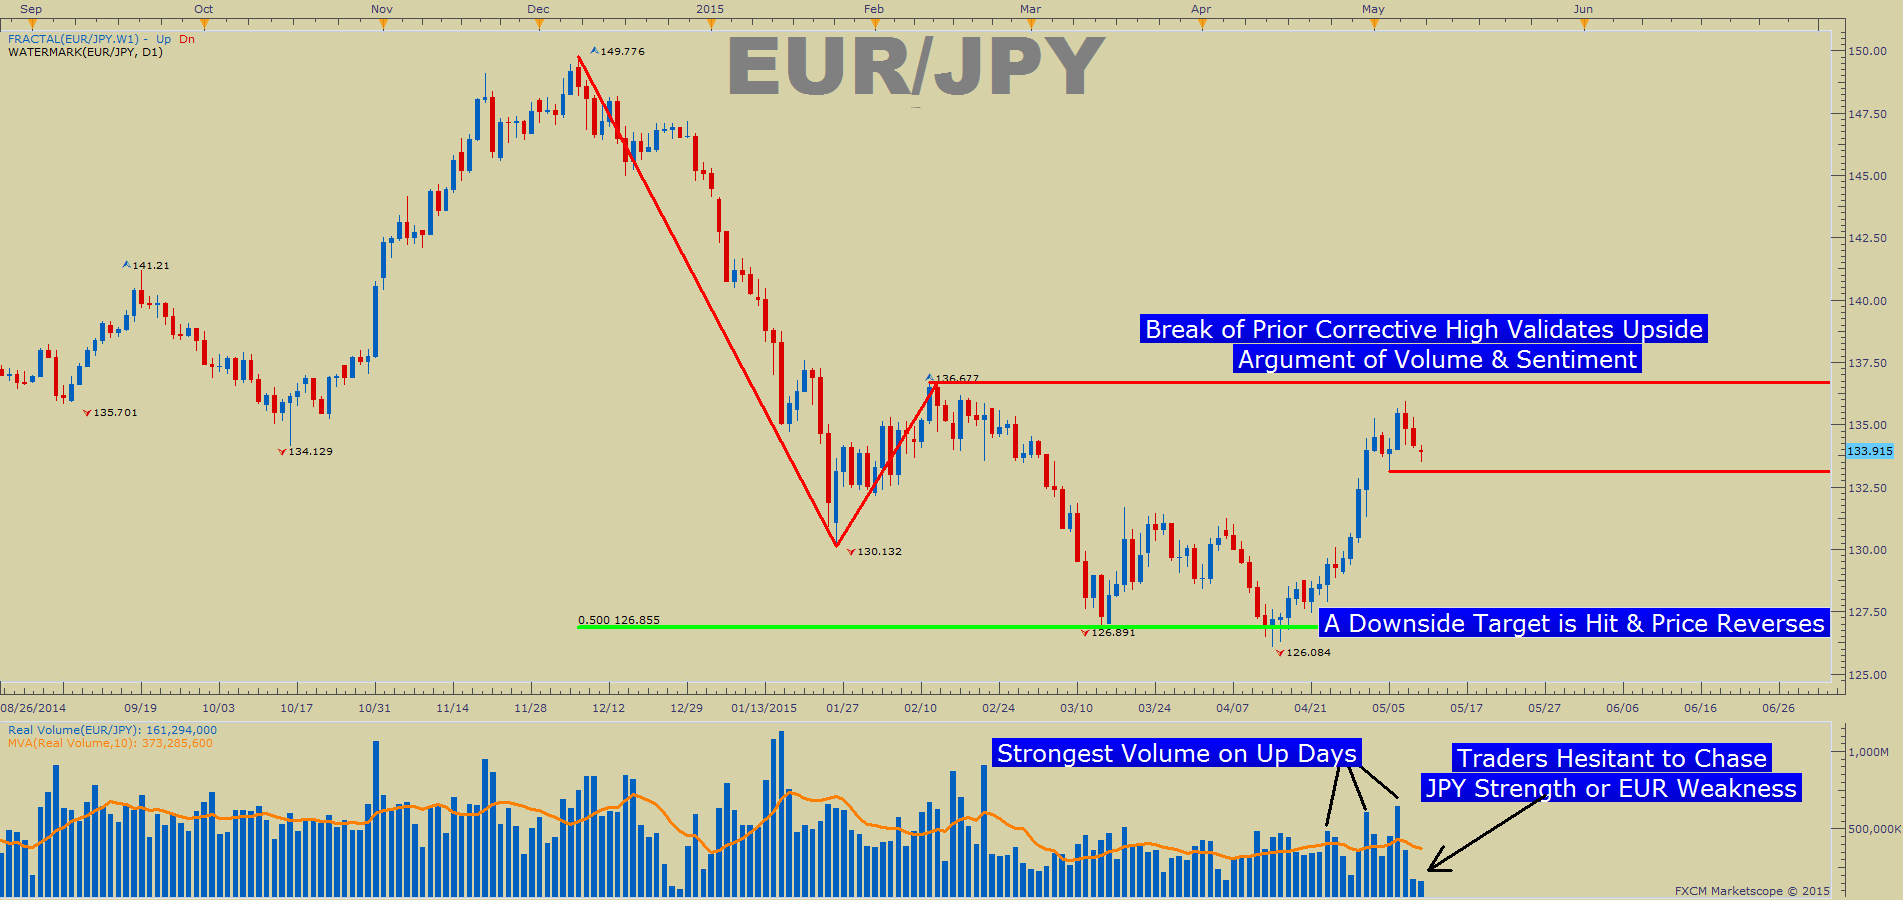
(Created using Marketscope 2.0 charts)
Even though the EURJPY is over 700 pips off its low, it still might have some legs to move further north. As we have found in our traits of successful traders research, fighting a developing trend can prove futile.
Looking at the price action on the chart, 136 25 through the 136.75 area shows resistance. A break above that level with volume continuing to show endorsement of buyers and SSI continuing its path lower will help to validate the upside view.
EUR/JPY SSI Reaches -2.08 : Bullish
The Speculative Sentiment Index or SSI is a contrarian tool where we look to take trades that are opposite of its reading. So during times when SSI is positive, we would look for sell trades and when SSI is negative, we would look for buy trades. Typically, a reading above 1.5 or below -1.5 are seen as statistically significant and increases the need to be on the watch out of breakouts occurring against retail crowd positioning.
The inverse relationship that SSI has with price might point us towards a higher EURJPY. 68% of retail traders are short. An SSI value of -2.08 is the lowest SSI value we have seen since the December 2014 high. We use our SSI as a contrarian indicator to price action, and the fact that the majority of traders are short gives signal that the EURJPY may continue higher. The trading crowd has grown further net-short on a week over week basis. The combination of current sentiment and recent price action changes gives a further bullish trading bias.
Learn Forex: EURJPY SSI Hits 12-Month Lows
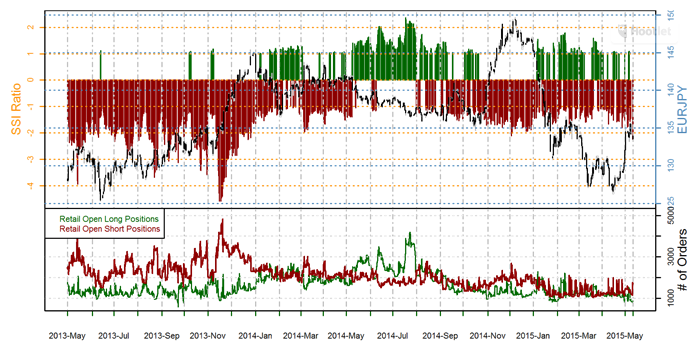
(Screen capture from DailyFXPlus.com)
In Conclusion
As a trader, some of the most exciting new trends and trades come after a long-held belief in the market is reversed. This currently is happening with EURJPY as a strong trend that took us from 149.77 in December 2014 came to as low as 126.08 or nearly 2500 pips lower by March 2015. The sentiment and volume are providing signals showing the turn higher could have room to run however, risk must always be managed in case this does not develop as it has historically. Continue to watch price action, sentiment, and volume to see if the view of a turn higher continues. Also, feel free to utilize a demo account to practice trading risk-free before trading with real money if you are just starting out.
Happy Trading!
---Written by Tyler Yell, Trading Instructor
To contact Tyler, email tyell@dailyfx.com
To be added to Tyler's e-mail distribution list, please click here
Tyler is available on Twitter @ ForexYell
Video Lessons || Free Forex Training
Trading Using Fibonacci (13:08)
Trading With Moving Averages (14:25)
Reading the RSI, Relative Strength Index (13:57)
Money Management Principles (31:44)
Trade Like a Professional Workshop (1:44:14)


