


Talking Points:
- The triangle formation can show in three varieties; we outline each below.
- Triangles signal congestion or consolidation as the range of price movement decreases.
- Traders can look to trade breakouts by treating triangles like other congestion patterns.
Price Action can bring a significant amount of value to the trader. It’s not a coincidence that you’ll hear so many traders mention this form of analysis as part of their ‘bread and butter.’
It’s simple, it’s concise, and most importantly – it’s not misleading: And that is because price action, or the study of previous price movements, merely tells us what’s happened in the past. It doesn’t purport to tell us what will happen like many indicators try to do (and that are inevitably wrong a portion of the time).
If you’d like to establish a foundation in the study of price action, we have a litany of resources available for you.
Four Simple Ways to Become a Better Price Action Trader walks through a simple process to do just that, and as part of that article we offer the Price Action Course via Brainshark. This is completely free-of-charge, and you can take this whenever you’d like however many times you’d like to take it.
Price Action Course via Brainshark
The Triangle
As we discussed in Trading Trends with Price Action, trending markets will often put in a series of ‘higher-highs’ and ‘higher-lows’ (during up-trends), or ‘lower-lows,’ and ‘lower-highs,’ during down-trends. But what about those situations in which price action isn’t putting in higher or lower prices?
This can often happen after a market puts in a sizeable move in a short period of time, as buying and selling pressure roughly offset. A prime example of this can be seen in the USDJPY chart, after the massive run the pair put in beginning with the fourth quarter of 2012.
After ‘Abe-nomics’ took Japan by storm, traders around the world sold Yen in anticipation of the ‘three arrows’ approach ending the decades-long deflationary spiral that had engulfed the nation.
In short order, USDJPY had traded from sub-80 to 103.67. The move went so far, so fast that most buyers in USDJPY were already long. So by the time we hit 103, the market was heavily long and much of the announced news was ‘priced-in’ to the market.
This means there weren’t enough buyers to push prices higher. And just as we saw in The Forces of Supply and Demand, the simple act of no new buyers can create a down-swing in price in the same way as an influx of new sellers.
USDJPY put in a 950-pip drop in a little over three weeks, establishing support slightly inside of 94. But for the next four months, the pair stayed confined between these support and resistance values of 103.67 and 94, making progressively higher lows and lower highs (the opposite of what is wanted for a trending market); and this creating converging trend lines that gave us this symmetrical triangle:
The Symmetrical Triangle
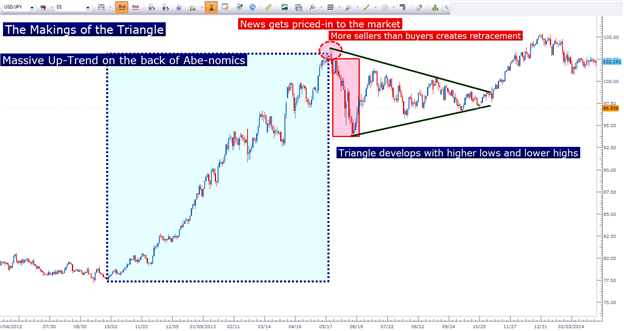
Created with Marketscope/Trading Station II; prepared by James Stanley
Do you notice what happened on the right side of that chart – after the triangle was broken? The trend came right back to order, making a new high above 105. This is why we want to know how to identify these formations when they occur: They can tell us quite a bit about the general market condition and what might be going on. But this isn’t the only type of triangle that we might see on the chart. We can also see ‘biased’ triangles that have a horizontal support or resistance level.
The Ascending Triangle offers higher lows, with horizontal resistance, and the Descending Triangle is the exact opposite, with lower-highs and a horizontal zone of support, as seen below in the current US Dollar chart:
The Descending Triangle in the US Dollar Chart

Created with Marketscope/Trading Station II; prepared by James Stanley
Trading the Triangle
Across the numerous sources on the internet that teach triangle trading, many of them attempt to teach traders to carry a bias into these formations.
As in – during an ascending triangle, many folks will often attempt to look at the formation as carrying a bullish bias due to the higher-lows. But keep in mind – if the market hasn’t been able to make higher-highs, this is not a trend, nor is this necessarily a bias that we can feel good about.
All that we truly know in the situation of an ascending triangle is that resistance hasn’t been able to budge.
The direction that the triangle will break is going to be determined by whether more supply or demand comes into the market at the end of the formation; which often happens around news announcements – and these are pretty unpredictable.
These are all unknown factors.
Look at triangles – all of them, whether they are ascending, descending or symmetrical – as congestion patterns and congestion patterns only. All that we truly know from this formation is that supply and demand are roughly off-setting each other over a specific period of time: that’s it.
And this isn’t necessarily a bad thing, because congestion or indecision formations can be a price action trader’s best friend. We outline how traders can embark on speculating in such scenarios in the article, The Most Important Price Action Formation is Indecision.
This goes right back to the allure of trading price action in the first place – in that there are no messages or formations for what will definitely happen in the future. It’s simply a way of analyzing the market to see where we, as traders, may be able to seek out strong risk-reward ratios in which we can make more if we win than we’ll lose if we’re wrong.
--- Written by James Stanley
Before employing any of the mentioned methods, traders should first test on a demo account. The demo account is free; features live prices, and can be a phenomenal testing ground for new strategies and methods. Click here to sign up for a free demo account through FXCM.
James is available on Twitter @JStanleyFX
Are you looking to take your trading to the next level? The DailyFX 360° Course offers a full curriculum, along with private, weekly webinars in which we walk traders through dynamic market conditions using the education taught in the course.
Would you like to trade alongside seasoned professionals throughout the trading day? DailyFX On Demand gives you access to DailyFX Analysts during the most active periods of the trading day.
Would you like to enhance your FX Education? DailyFX has recently launched DailyFX University; which is completely free to any and all traders!


