


Talking Points:
- Recap of thePrior Pre-Trend Patterns Discussed
- The 3rd Pre-Trend Pattern: Flat Corrections / Double or Triple Bottoms
- Setting Stops & Profit Targets
If you can get a clean understanding of the typical patterns that develop before the trend resumes, you can find yourself entering at incredibly favorable entries with an excellent risk: reward ratio. This series of articles takes a look at common patterns that are known as trend corrections and can be applied to any time frame you trade.
Recap of the Prior Pre-Trend Patterns Discussed
The two patterns we’ve looked at so far are sharp zig-zags, which are 3-wave patterns against a prior trend that doesn’t make a new low and will often move into a Fibonacci retracement, and Triangles. Triangles are a congestion pattern that take up a decent amount of time but usually end with an aggressive thrust out of a triangle. A key note about triangles that we discussed was that the move out of the triangle can be the last move of the trend so you should be cautious of trend termination after the thrust out of the triangle is completed.
Learn Forex: Triangle Example from Pre-Trend Chart Patterns Every Trader Should Know: Part II
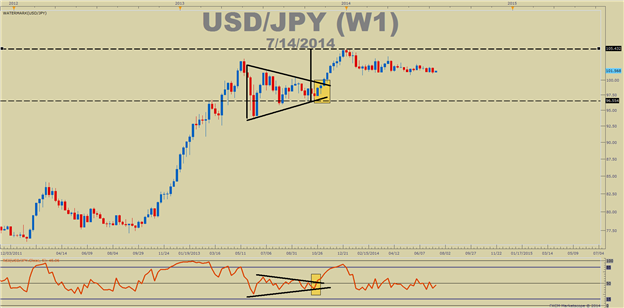
Presented by FXCM’s Marketscope Charts
Triangles are clean and easy to read, however being caught with an open trade during a triangle while anticipating a breakout can be frustrating. For that reason, the article discussed key technical levels that can help you seen what a triangle is likely over and the trend has resumed.
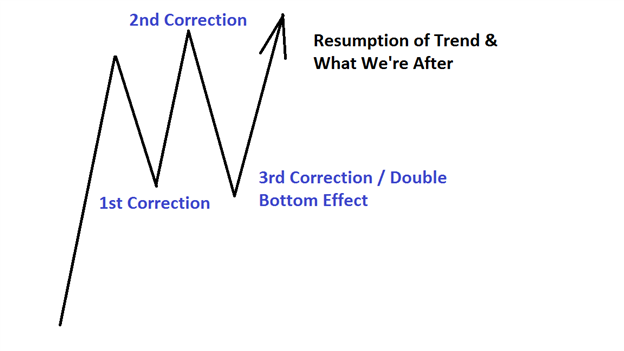
The 3rd Pre-Trend Pattern: Flat Corrections / Double Bottom
The name may not be exciting, but the flat correction is a clean pattern that can help traders clearly define and take advantage of risk. Also, the flat correction can take the form of an intra-trend double-bottom, which makes it easy to spot and trade. This type of move often happens after a strong or extended move but once broken, a stop can be put under the correctionary low or you can trail your stop with each new swing low.
What’s important to see is that after a strong move higher or lower, the market goes into a period of consolidation or range environment. Cable or GBPUSD has had a handful of very clean flat corrections within the overall trend. You’ll notice that price makes no major moves higher or lower and looks to trace out the flag pattern, which is a traditional technical analysis pattern before resuming the trend.
Learn Forex: Clean Flat Correction Traces Out Before Trend Resumes
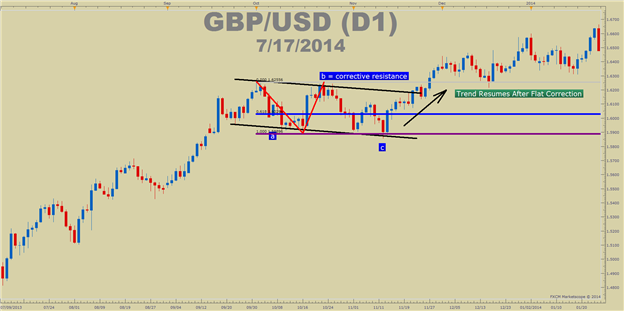
Presented by FXCM’s Marketscope Charts
When you’ve identified the making of a flat correction, you can look for three things to help you see that a flat correction is playing out and when the correction is over so that you can look to take a well-managed trade in the direction of the trend.
- Draw a Channel from the Trend Top & ‘b’ Wave & Draw a Parallel to the ‘a’ point
- Look For Fibonacci Relationships to Catch The Exhaustion of the Pattern
- Look for the breaking of ‘b’ on a daily closes bases
All three of these instances took place on this chart and a variation of these three will happen more often than one would think as you look for these flat corrections to take place on the chart before the trend resumes.
If you’re uncomfortable with great trade management, you can register for our free trade management course, join here.
Setting Stops & Profit Targets
There are clear benefits and a few drawbacks to trading the easily recognizable flat pattern. The benefit is that it is easy to recognize in bull and bear markets and the risk is very clear when you believe a correction has ended. The drawback is that if you’re entering on a break of ‘b’, you might have a hard time finding a trade with a good risk: reward ratio if you’re putting your stop below the recent pivot. For that reason, I like to look for the corrective move within the leg of the trade you’re about to enter.
Learn Forex: EURUSD Flat Correction Looks To Be Ending
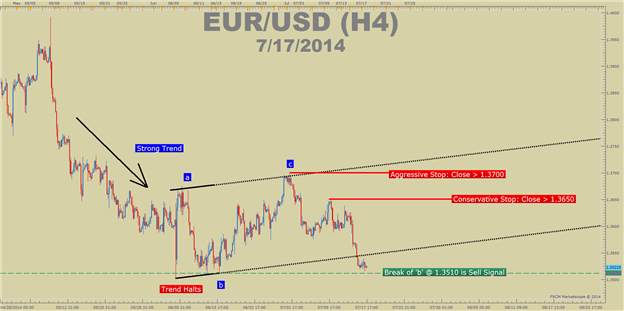
Presented by FXCM’s Marketscope Charts
You’ll notice above that you have two options for placing a stop when you recognize an entry. The path you choose will likely depend on your risk tolerance. If you’re looking to risk less, you’re likely going to choose the corrective high labeled as the “conservative stop”. The conservative name is due to taking on less risk to see if the trade works out in your favor.
Happy Trading!
---Written by Tyler Yell, Trading Instructor
To contact Tyler, email tyell@dailyfx.com
To be added to Tyler’s e-mail distribution list, please click here
Tyler is available on Twitter @ForexYell
Add me to your Google+ Forex Circle


