


Talking Points:
- Psychological price levels can change trends and create swings within the market.
- Traders can combine psychological levels with other forms of Support and Resistance to find which levels may have the most potential.
- Areas of confluent support and resistance can offer entry potential for swings and new trends.
In our last article, The Hidden Levels of Support and Resistance in the Forex Market, we looked at the study of ‘Psychological’ support and resistance levels.
As we shared in the article, human beings often think in round numbers and traders are no different. This means that stops and limits will often exist around these ‘rounded’ intervals on the chart, and as trends move and prices surge into these batches of waiting orders; price action can change dramatically.
Trends can be stopped dead in their tracks… and if the batch ‘sitting orders’ are large enough, a full-on reversal may be afoot.
In this article, we’re going to attempt to take this study a step further by helping traders to notice which of these levels may end up carrying more weight with future price action.
Support and Resistance Does Not Exist in a Vacuum
A common question that new traders pose is ‘which type of support or resistance should I be watching or which is most important?’
The only truthful answer to this question is that it’s impossible to know which support or resistance level may elicit a change in price behavior until it’s already happened.
But traders can attempt to see which prices may carry more power by aligning multiple permutations of support or resistance analysis, and looking for commonalities.
Let’s walk through an example together.
In EURUSD earlier this morning, selling denominated the early portion of the European session. Prices dropped from 1.3715 to 1.3650 in the first four hours of European trade.
In the first hour of trade, prices moved down to the S1 weekly pivot point (the red line on the chart at a price of 1.3771), and then selling slowed. It didn’t stop, as prices still moved lower; but it did slow.
Confluence can be powerful, in both the short and long-term
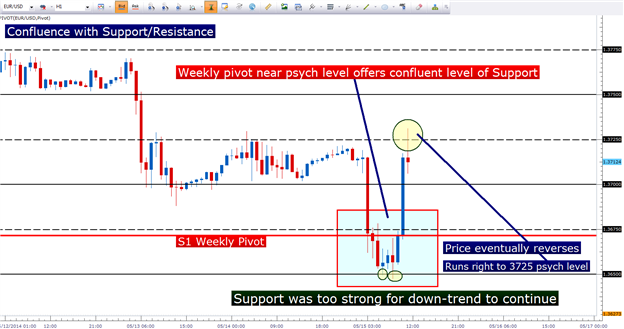
Created with Marketscope/Trading Station II; prepared by James Stanley
Over the next 3 hours, price action grinded lower until a price of 1.3650 was hit (a minor psychological level highlighted by the first yellow circle), at which point buyers began to come in. Notice how price action oscillated between the psych level, and the S1 Pivot for four hours, even attempting to move lower but reversing yet again at 3650 (second yellow circle).
After the second attempt at breaking 1.3650, sellers retreated and buyers took over, as prices then began moving higher, eventually catching resistance at the psychological level of 1.3725 (third yellow circle).
This is confluence; and while the S1 weekly pivot point wasn’t enough to turn around prices, the combined force of the S1 pivot along with a psychological support/resistance level at 1.3650 certainly was. This is why traders want to use multiple forms of support and resistance identification, because you never know which one (or which combination) will impact prices until after it’s happened.
Why/How does confluence work?
The bigger question to ask is why technical analysis might work?
The logic behind technical analysis is that if enough people are seeing something, and thus reacting to those stimuli, it can potentially become a self-fulfilling prophecy.
Take the 200-day moving average as an example. If every trader in the world were watching AUDUSD trade up to the 200-day moving average; and if enough traders sell under the premise that resistance may come in – that can change the supply and demand in that market, and that can create a reversal in price (more buying than selling means prices will move up). In the example below, we can see how the confluent level of .9750 in AUDUSD promulgated a strong reversal in the trend.
Confluence can exist between indicators and psychological levels
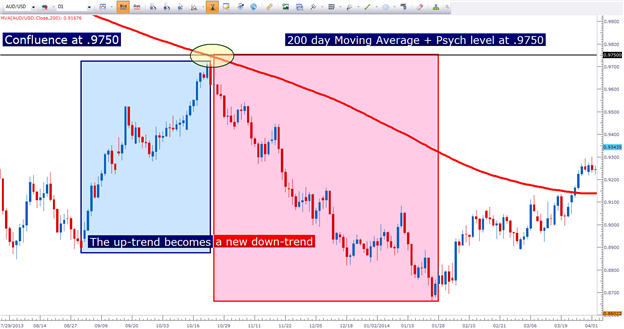
Created with Marketscope/Trading Station II; prepared by James Stanley
Support and resistance levels are no different. As prices approach these levels, traders observe the potential for a reversal.
And when multiple support or resistance levels exist in the same region or area, this is called ‘confluence,’ and this confluence of support or resistance can offer traders multiple reasons for prices to reverse or stall; making potential trade ideas for swings or reversals even stronger than they might be otherwise.
How to Find Confluent Levels of Support and Resistance
Just as we said in the earlier portion of this article, traders are best served by following and observing multiple forms of support and resistance analysis.
Price action can be used to validate which levels have been valuable, as traders can notice swings in prices or reactions in markets to see which price levels have elicited new behaviors.
But traders can attempt to see which levels may offer a higher chance of exhibiting support or resistance in the future by applying multiple studies.
Longer-term pivot points (weekly and monthly) will usually generate considerable interest, and the same can be said for Fibonacci retracement levels within longer-term trends.
Traders can apply these on the longer-term charts as I had in the EURUSD example, while following the more granular psychological support and resistance levels on the longer-term charts.
Traders can also look to indicators, as we had in the AUDUSD example with the 200-day moving average. Parabolic SAR, Volatility bands, or Price Channels can all be applied to the chart in the trader’s search for confluent levels of support or resistance.
How to Trade Support and Resistance Confluence
So support and resistance confluence can show us areas where reversals or swings may take place, but what’s next?
Traders should keep in mind that there is no form of analysis that will predict future price movements. If there were, there would be no reason for me to write this article, or for you to read it. Trading would be easy because we could follow this ‘holy grail’ all the way to the promise land. Unfortunately, the future is and will remain unpredictable.
Instead, trading is about probabilities. And seeing an up-trend stall at resistance, or a down-trend pause during support simply shows us an area where a reversal in price may take place.
As price action signals potential reversals, traders can look at this as an opportunity for a potential trade entry with a positive risk reward ratio. As in, if you’re right – you can look to make $2 for every $1 that you’re risking in the event that you’re wrong. This is the effort to avoid the Top Trading Mistake, or The Number One Mistake that Forex Traders Make.
Traders can use price action to signal entries after integrating Support and/or Resistance
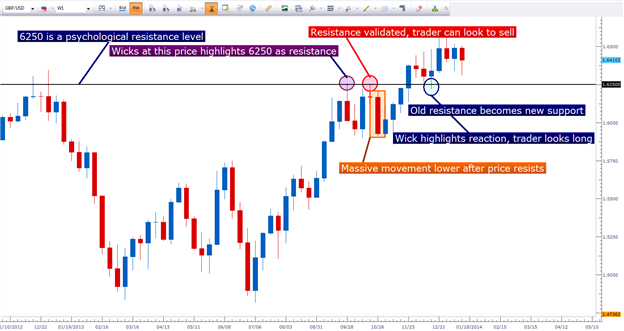
Taken from The Price Action Trigger, by James Stanley
You can use this in combination with multiple time frame analysis to trade retracements in ‘major’ trends on longer-term charts; or you can even include additional indicators such as I do in my short-term momentum trading strategy.
The possibilities are endless; but provided traders are focusing on risk management and risk-efficient entries, there are numerous ways that support and resistance confluence can beneficially be integrated into a trader’s approach.
We walked through such an approach in the article How to Catch Swings in the Forex Market.
We further explored the topic of using price action to trade swings in the article How to Identify Positive Risk-Reward Ratios with Price Action.
--- Written by James Stanley
Before employing any of the mentioned methods, traders should first test on a demo account. The demo account is free; features live prices, and can be a phenomenal testing ground for new strategies and methods. Click here to sign up for a free demo account through FXCM.
James is available on Twitter @JStanleyFX
Are you looking to take your trading to the next level? The DailyFX 360° Course offers a full curriculum, along with private, weekly webinars in which we walk traders through dynamic market conditions using the education taught in the course.
Would you like to trade alongside seasoned professionals throughout the trading day? DailyFX On Demand gives you access to DailyFX Analysts during the most active periods of the trading day.
Would you like to enhance your FX Education? DailyFX has recently launched DailyFX University; which is completely free to any and all traders!
We’ve recently begun to record a series of Forex Videos on a variety of topics. We’d greatly appreciate any feedback or input you might be able to offer on these Forex videos:


