


Talking Points:
- Traders should look to focus their strategies in appropriate market conditions.
- Multiple time frame analysis can offer a ‘bigger-picture’ view of a market.
- Traders can choose to trade trends, ranges, or breakouts based on their analysis.
In our last article, we looked at The Life Cycle of Markets. As we discussed, markets will often display one of three major market ‘conditions,’ which can greatly denominate the manner in which that trader should look to speculate.
Trends show a bias that has been displayed in the market place; and when a strong trend is available, the trader’s job is simple: To trade in the direction of that trend. If the trend is up, the trader should look to buy; and if the trend is down, the trader should look to sell.
Unfortunately trends don’t always exist; and when that often entails congested, range-bound price movements as bulls and bears both fight to take over control of the market in search of the next trend. These range-bound environs can be more dangerous, and given the limited upside that might be available, many traders will often eschew trading the range; instead waiting for the inevitable breakout that may end the range and lead into a new trend.
The Varying Tonalities that a Market May Show

Image Taken from The Life Cycle of Markets
In this article, we’re going to discuss how traders might look to focus their strategies on the appropriate market condition.
The Benefit of Multiple Time Frames
The value of being able to get a ‘bigger picture’ view on a market cannot be understated. To think of the value of multiple time frame analysis, think of trading in a currency pair like buying a home.
If you’re going to buy a home, you’re likely going to want more of an overview than simply driving by and getting a quick glance. This is like trading a currency pair when only seeing one time frame.
When buying a home, you’ll likely want to get out of the car and walk around to ensure that the back yard isn’t in complete disarray. You want to check the foundation to make sure that you’re not going to have exorbitant repair expenses in your future. You want to get as much information as is feasibly possible to make the most intelligent purchasing decision that you can.
Trading in a market isn’t all that different, the more information you have the more of an informed decision that you can make.
In The Time Frames of Trading, we offer some common time frames based on desired holding time.
Multiple Time Frame Intervals for Trend Diagnoses/Entry

If a trader is looking to hold a position for a few hours to a few days (commonly called ‘Swing Trading’), the four-hour chart can be the optimal time frame for entering positions.
And if the four-hour time frame is being used to enter positions, the daily chart can be used to gauge the trend (or lack thereof); so that the trader can ensure they are focusing the optimal approach on the prevailing market condition.
Or perhaps a longer-term trader wants to use the daily chart to enter trades. Well, then the weekly chart can be used as the longer time frame to guide the trader’s decision-making processes.
The benefit of using a longer time frame in the decision as to which strategy to utilize is that the trader can take more information into account, getting an idea of the ‘bigger picture’ before executing on their strategies.
Gauging Trend Strength (or lack thereof)
Once a trader has determined the time frame with which they want to look to grade the prevailing trend, focus can then be diverted to investigating the strength of that trend.
Price Action is a popular mechanism for doing so. Traders can simply look as to whether a market is in the process of making ‘higher-highs’ and ‘higher-lows.’ If this is taking place, then the trader is witnessing an up-trend, and can look to move down to the shorter time frame in an effort to buy as efficiently as possible. The picture below shows how a trader using price action can look to buy on the shorter time frame:
Price Action can be Beneficial in Grading Trends, and Plotting Entries

Image taken from Using Price Action to Trade Trends
Another popular way of grading trend strength on the longer-term chart incorporates the ADX indicator. ADX, or the Average Directional Index is an indicator created by J. Welles Wilder that was designed specifically to grade trend strength. The downside of this is that it doesn’t show which direction the trend might be moving, only whether the trend is ‘strong’ or ‘weak.’
Traders can use the ADX indicator on the longer-term chart to determine whether or not a trend is being seen in the market. If values are reading over 30 on ADX, then traders will often look to execute trend-based strategies.
The Average Directional Index (ADX)

Image Taken from ADX: The Average Directional Index
If readings are under 30, then traders will often look to employ range or breakout strategies.
Now that the Trend is determined, what’s next?
The shorter time frame is where the trader will often look to enter into the market based on the analysis on the longer time frame.
If a trend was found on the longer time frame, the trader’s job is to find a way to enter in the direction of that trend. On the lower time-frame, the trader can look to buy up-trends cheaply, or to sell down-trends expensively. This can be done with price action; or traders can look to incorporate indicators to offer a ‘trigger’ in the direction of the longer-term trend on the shorter time frame. Some common indicators for triggering positions on the shorter time frame are MACD, Stochastics, and the Commodity Channel Index (CCI).
The Commodity Channel Index Can Offer Numerous Entry Opportunities
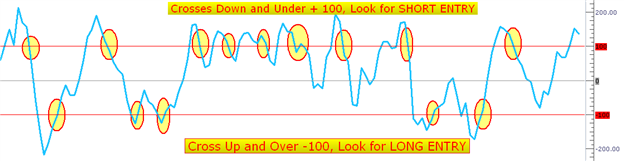
Taken from When the Market Gives Ranges, Trade Ranges!
If a Range-bound market condition was seen on the longer time frame, the trader has another decision to make before deciding how to enter: Does the trader want to trade continuation of the range, or the eventual breakout?
The logic of the range-bound entry and the breakout is directly opposite: Trading ranges entails selling highs, and buying lows (in anticipation of the range continuing), while trading breakouts involves buying new highs and selling new lows (with the expectation of the breakout bringing new highs or new lows into the market). We cover how traders can look to approach ranges in more depth in the article, How to Trade Ranges.
If trading for the break, traders can look to place entry orders slightly outside of support or resistance levels so that once a new high or low is printed, the trade is entered and the trader can look for new highs or lows. We talked about how this can be done in the article, Trading the Break.
If traders are looking to trade the range, an oscillator can be used similarly in the way that a trader would buy or sell in a trend (with the notable exception that up-side is limited). In both trends and ranges, traders want to look to ‘buy low’ and ‘sell high.’ The same types of tools can be used to determine when to buy and when to sell; MACD, Stochastics, and CCI are all popular mechanisms to trade in range-bound market conditions just as they are with trends.
-- Written by James Stanley
James is available on Twitter @JStanleyFX
To join James Stanley’s distribution list, please click here.
Would you like to enhance your FX Education? DailyFX has recently launched DailyFX University; which is completely free to any and all traders!
We’ve recently begun to record a series of Forex Videos on a variety of topics. We’d greatly appreciate any feedback or input you might be able to offer on these Forex videos:


