


Talking Points:
- In 2013, USDJPY tested and rebounded from yearly pivot points numerous times.
- USDJPY could retest the Central yearly pivot down at 99.08
- USDJPY has traded between 102.00 and 103.50 for 6 days while other yen pairs have broken down
In my previous article showing yearly pivots for EURUSD, you got a roadmap of potential areas of support and resistance that could lead to significant moves. Support and resistance are areas where traders can enter a trade with the least amount of risk with the most amount of potential reward.
In this article, we will continue this examination of the not-so-often discussed USDJPY yearly pivots. Yearly pivots may show the end of this correction and reveal a potential trade setup to catch the resumption of a very powerful USDJPY uptrend in its earliest stages.
Learn Forex: USDJPY 2013 Yearly Pivots
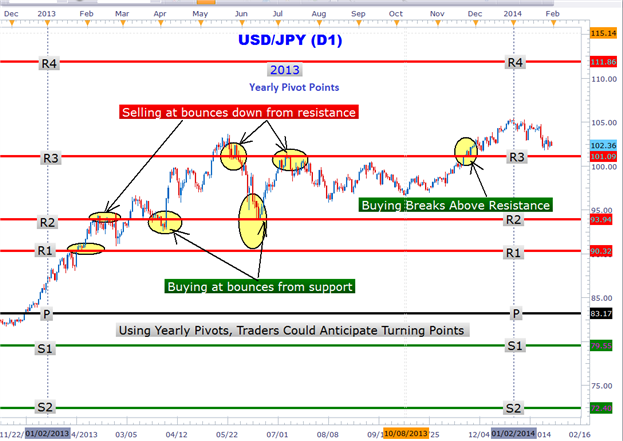
(Created using Marketscope 2.0 Charts)
As evident in the USDJPY daily time frame chart, that yearly pivots provided traders with several good entry points in both trending and ranging environments. The February break higher above the R1 pivot (90.33) led to the move to the New Year’s high of 105.43. However, the move higher was not in a straight but had several retracements at yearly pivots.
Since many traders are not paying attention to these invisible areas of support and resistance, they were caught off guard when USDJPY stalled in a particular areas or bounced from other areas. USDJPY behavior can be easily explained once yearly pivots are applied to the chart.USDJPY close above the R3 pivot in December 2013 at 101.09 led to over a 400 pip run into 2014.
Learn Forex: USDJPY 2014 Yearly Pivots

(Created using Marketscope 2.0 Charts)
USDJPY Yearly Pivot Trading Plan
As you can see in the chart above, I have manually created yearly pivots using the formula found in the first article and the 2013 USDJPY high, low and closing price. Currently, USDJPY is trading at 102.30 between the central pivot at 99.08 and R1 at 111.63. If USDJPY correction continues to move down to 99.08 and rebounds from this area, we could see a move to 111.63 and beyond. The central pivot also coincides with a 61.8% Fibonacci retracement area as well. January’s US Employment report could be the catalyst. Another weak job number could spark more risk aversion and a flight into Yen.
On the other hand, a close below P (99.08) could lead to a run down to the S1 92.75 level. Notice how these pivots have several hundred pips of space between them and are ideal for longer term trading but can be very effective in short-term day trading in providing high probability entries and exits near these levels. This allows traders the opportunity to trade in and around a core position.
In sum, USDJPY yearly pivots are worth adding to your charts so you can be ready for the next leg up in USDJPY.
---Written by Gregory McLeod Trading Instructor
To contact Gregory McLeod, email gmcleod@dailyfx.com.
To be added to Greg’s e-mail distribution list, please click here
Follow me on Twitter @gregmcleodtradr.
This article showed how to forecast support and resistance with pivots. Another way to find an entry is with the use of Fibonacci Retracements. Sign my guestbook to automatically enroll in a 20-minute Fibonacci Retracement course. By watching the slide presentation and taking the short quizzes you can dramatically increase your trading knowledge
Watch Greg McLeod at 9:30 ET in the DailyFX+ Live Classroom
This article outlined a plan for trading a head and shoulders breakout. Another way to find an entry is with the use of Fibonacci Retracements. Sign my guestbook to automatically enroll in a 20-minute Fibonacci Retracement course. By watching the slide presentation and taking the short quizzes you can dramatically increase your trading knowledge


