


Talking Points:
- Pivot points is a popular and easy way that traders can identify potential support and resistance
- Pivot points are based on a mathematical calculation that uses the previous high, low and close of a specified period; weekly, daily, monthly, yearly
- Yearly pivots can forecast maximum and minimum price extremes for the coming year as well as areas where price can change direction.
As we learned in the previous article, many traders regard pivot points as significant areas of support and resistance. Pivot levels are points where price usually changes direction. Though technology and markets have evolved, pivots have remained a staple and cornerstone of technical analysis.
While most traders are familiar with daily, weekly, and even monthly pivots which fit their type of trading, yearly pivots can also be used to forecast future potential support and resistance areas. Buying at or near a significant area of support and selling at a key area of resistance is the main focus of any trader no matter what the market or the duration traded. Yearly pivots can be monitored for those key trading opportunities.
Learn Forex: EURUSD Yearly Pivots
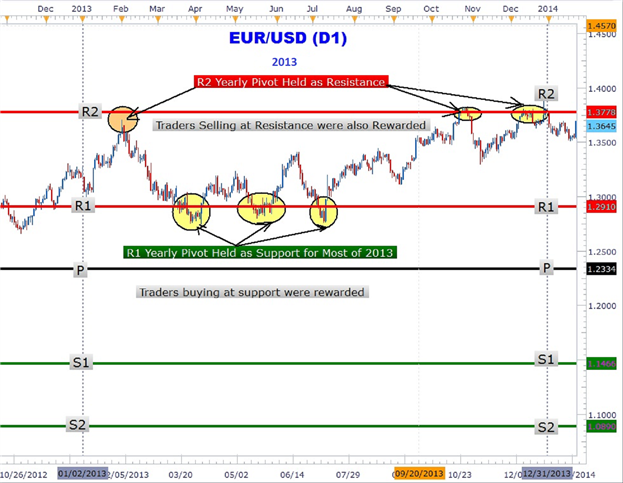
(Created using Marketscope 2.0 Charts)
As you can clearly see in the Euro chart above, forex yearly pivots have been plotted. These have been manually created as Marketscope 2.0 charts currently does not have a yearly pivot point setting. Notice how the Euro rallied up to the R2 pivot and turned around sharply falling over 600 pips in February.
Another significant area that can be easily seen showing the power of yearly pivots is the triple touch of the R1 yearly pivot at 1.2910. The third and final touch led to over a 600-pip rally back to the R2 yearly pivot to close out 2013 up over 4%.
Learn Forex: EURUSD 2014 Yearly Pivots

(Created using Marketscope 2.0 Charts)
EURUSD 2014 Yearly Pivots
Could forex yearly pivots show traders the next move in the Euro? In the chart above the 2014 yearly pivots are plotted on the EURUSD chart. The year is just getting started and the great thing about yearly pivots is only having to draw them once a year! EURUSD is trapped between the central pivot at 1.3461 and R1 at 1.4177. As at the time of this writing, the Euro has not tested either pivot. However, forex traders may be waiting for a move down to the central pivot (1.3461) for a move back toward the R1 (1.4177) yearly pivot resistance.
Alternative scenario is for the Euro to make an immediate run for it up to the R1 level. At R1 pivot resistance, traders may look to take profit on their longs and/or short the Euro at this level. However, a close above R1 could lead to a move higher to the R2 pivot (1.4610). Traders should also consider the possibility of a close below the central pivot that could lead to a prolonged down push to the S1 (1.3028) level.
Forex traders who are either scalpers, position, or swing traders can make use of yearly pivots to locate key areas of support and resistance. Look for future articles on other currency pairs that lay out the yearly pivot ‘landscape’ to help you navigate the forex market.
---Written by Gregory McLeod Trading Instructor
To contact Gregory McLeod, email gmcleod@dailyfx.com.
To be added to Greg’s e-mail distribution list, please click here
Follow me on Twitter @gregmcleodtradr.
This article showed how to forecast support and resistance with pivots. Another way to find an entry is with the use of Fibonacci Retracements. Sign my guestbook to automatically enroll in a 20-minute Fibonacci Retracement course. By watching the slide presentation and taking the short quizzes you can dramatically increase your trading knowledge
Watch Greg McLeod at 9:30 ET in the DailyFX+ Live Classroom


