


Talking Points
- Oscillators can be used to trigger trades with the trend.
- CCI will help traders evaluate overbought / oversold levels.
- Entries with CCI occur when momentum returns with the trend.
When traders need an indicator for planning an entry for a trending market trading plan, normally oscillators come to mind. Oscillators are a class of indicators designed to track price by moving (oscillating) either above or below a centerline. Today we will review CCI (Commodity channel index), which is a popular oscillating indicator and discuss how we can use it to trade retracements back in the trend.
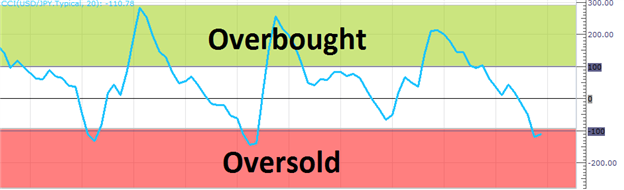
Learn Forex – CCI Overbought / Oversold
Reading CCI
If you are already familiar with other oscillators such as RSI (Relative Strength Index), you may already be familiar with how to read CCI. Both indicators use a mathematical equation to depict overbought and oversold levels for traders. Pictured above we can see these levels marked with CCI moving between them.
CCI uses a +100 value to indicator overbought levels, while below -100 value represents an oversold value. It is important to notice that 70-80% of the time CCI values actually tend to fall between overbought and oversold levels. This means traders will need to remain patient while waiting for one of these scenarios to occur. As with other overbought/oversold indicators, this means that there is a large probability that the price will correct to more representative levels. Knowing this, trend traders will wait for the indicator to move outside of one of these points before reverting back in the direction of the primary trend. Let’s look at an example using the strong trend on Gold (XAU/USD).
Learn Forex – Gold & CCI
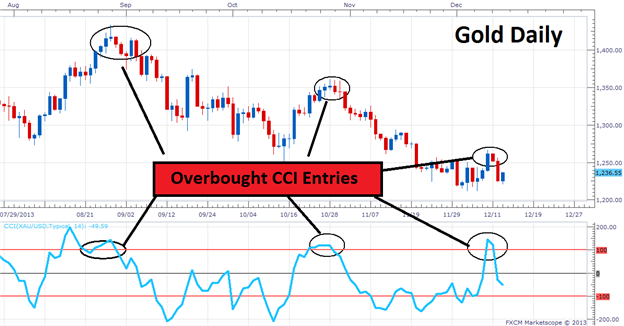
Gold & CCI
Above we can see an example of CCI in action using a daily graph of Gold, (XAU/USD). Due to the recent strength of the Dollar, and knowing that price the price of Gold has been moving generally lower, trend traders should look to initiate new selling positions. The primary way of timing entries with CCI in a downtrend is to wait for the indicator to move above a reading of +100 (overbought), and enter into the trade when CCI moves back below +100. This creates an opportunity to sell the currency as momentum is returning back in the direction of the trend. Traders should only enter after a full candle close on their chart, thus confirming a reading under the overbought value.
The above chart shows several past entries on Gold using CCI as an entry mechanism. Currently CCI is reading near its center line, so traders will need to wait for an opportunity to trade wait to trade the next retracement of the commodity.
---Written by Walker England, Trading Instructor
To contact Walker, email instructor@dailyfx.com. Follow me on Twitter @WEnglandFX.
To be added to Walker’s e-mail distribution list, CLICK HERE and enter in your email information.
Learn Your Next CCI Strategy!
Want to learn more about trading CCI? Sign up for our free CCI training course and learn new ways to trade with this versatile oscillator. Register HERE to start learning your next CCI strategy!


