


Talking Points
- How To Understand the Basic Pattern
- How To Understand Corrections vs. Impulses In Markets
- How To Understand Fibonacci In Relation To Wave Development
“I attribute a lot of my own success to the Elliott Wave approach.”
-Paul Tudor Jones, Tudor Jones Capital
Elliott Wave is a great trading tool for trading trends. However, it’s not as confusing as a lot people make it out to be when you consider the primary objective of the tool. Elliott Wave is meant to put the current move of the market in context for you, the trader.
Putting the market in context for you is of great help. For starters, if you know a market that has recently been in a strong trend is correcting, you can look for a resumption of the prior trend to enter at a favorable price. Also, you can look to see if the pattern is starting to break down to see if the prior trend has exhausted itself, and look to either take profits or enter a new trade in the direction of the new trend.
Understand the Basic Pattern
Learn Forex: The Overall 8-Wave Elliott Wave Cycle
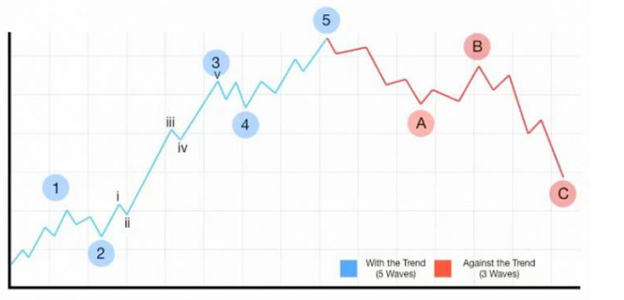
Courtesy of Daily Trading Course
The picture above is a mock-up that shows the progression of markets as seen in Elliott Wave. As you can see, the market is often broken up by strong trends and minor moves against the trend. The with-trend moves are known as impulse or motive waves and the counter trend moves are known as correction.
Another key aspect of Elliott Wave is that trends are fractal. Simply put, that means that each impulsive wave can be broken down into 5 smaller waves and each correction can be broken into 3 smaller segments of a counter-trend move. However, it’s often not overly necessary to label every single aspect of the wave.
How to Understand Corrections vs. Impulses in Markets
Learn Forex: 5-Wave Impulse & 3-Wave Corrections unfolding in GBPUSD
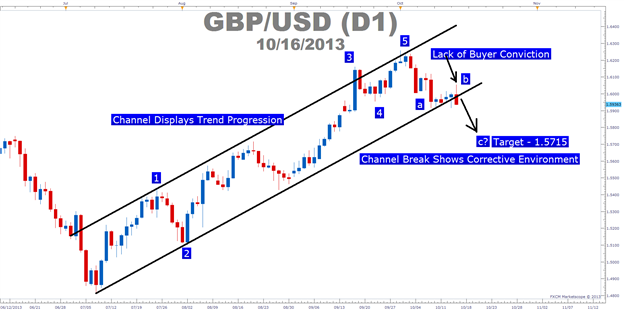
Chart Created by Tyler Yell, CMT
As illustrated above, the trend or impulse unfolds in 5-waves whereas corrections unfold often in a 3-wave pattern. You’ll often hear Elliott wave fans discussing trading based on 5-s & 3-s and that is because they identify the trend and countertrend moves based on the unfolding of a move in 5 & 3-wave patterns.
Furthermore, in understanding the basic 5-wave impulse or trend, you can be on the lookout for a 3-wave correction or developing correction. The purpose of looking for a correction is that as the trend resumes, you can look for the correction to be losing steam so that you can enter at a good price. What many traders who are unfamiliar with Elliott wave often end up doing is chasing the price or enter on the extension of the trend right before the correction begins. This causes them to get stopped out because they did not understand the context of the market and current trend when they entered the trade.
When looking at the 5-wave pattern and 3-wave correction to get context, you can see how the breaking down of GBPUSD has us looking for a correction to continue. Therefore, I’m taking the context as provided by Elliott Wave to get a better feel for GBPUSD. Once this corrective move to the downside completes, then I can look for a buy on a resumption of the overall trend to higher prices.
If you’re not trading GBPUSD, you can take a look at the chart you’re trading and see if you can identify any 5-wave or 3-wave structures. That will help you grab a context of the current market so that you can look for the maturity of the current trend or ideally the exhaustion of the correction. After you’ve identified a current market as ready to resume the trend, you can then look to Fibonacci numbers in order to see where the market is likely go to go as according to Elliott Wave.
How to Understand Fibonacci In Relation To Wave Development
“When R.N. Elliott wrote Nature’s Law, he explained that the Fibonacci sequence provides the mathematical basis of the Wave Principle”
-Elliott Wave Principle, Frost & Prechter pg. 91
Once you’ve been able to get context for the current trend, you can then look to Fibonacci numbers in order to find price objectives within Elliott Wave. In other words, the reason why Elliott Wave traders often utilize Elliott Wave is because you can have definitive levels as to where the correction may end with Fibonacci Retracements. Furthermore, you can have price objectives by utilizing the Fibonacci Expansion tool.
Learn Forex: Fibonacci Provide Price Objectives within Elliott Wave
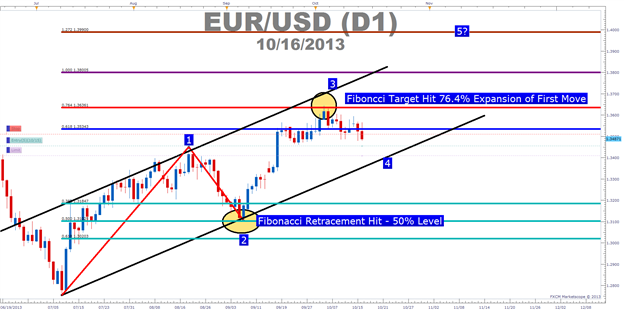
Chart Crated by Tyler Yell, CMT
One key thing to note when utilizing Fibonacci retracements within Elliott Wave is that there are levels to watch out for but rarely a level that the market must hit. Therefore, you want to focus on price action near levels like the 61.8% on a wave 2 and a 38.2% on wave 4. If you see a lack of conviction past these levels then you can look to a resumption of the overall trend off of these levels.
In terms of price objectives, you can use the Fibonacci expansion tool. The expansion tool takes three points on the chart to project the exhaustion of the next impulse. The most-commonly used targets are the 61.8%, 100% & 161.8% expansion. This simply means that this impulse is either 61.8%, 100% or 161.8% of the prior wave and simply shows you the progression and strength of the current trend.
Closing thoughts
Elliott can be a headache if you worry about labeling every wave and every correction. Instead, I’d recommend focusing on the big picture. In other words, are we in an impulse or a correction? More importantly, if we’re in a correction that’s about to be exhausted, where can we enter on the resumption of the trend?
Happy Trading!
---Written by Tyler Yell, Trading Instructor
To contact Tyler, email tyell@dailyfx.com.
To be added to Tyler’s e-mail distribution list, please click here.
Interested In Our Analyst's Best Views On Major Markets? Check Out Our Free Trading Guides Here


