


Article Summary: The Doji is probably the most simplistic formation to learn, but it can tell us quite a bit about price action. In this article, we introduce the Doji, we examine how it can be traded, and we then look at how traders can spot and trade reversals using the Doji, along the lines of what is taught in The Forex Trader’s Guide to Price Action.
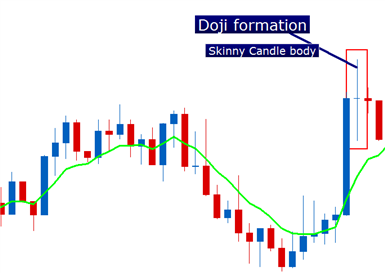
The first candlestick formation that most traders learn is probably also one of the most important. The Doji is notable for its small body found in the middle of the candle, with wicks on either side. The picture below illustrates the Doji formation:
The Doji has a skinny candle body, with wicks on either side
Created with Marketscope/Trading Station
What Messages Does the Doji Tell the Trader?
The skinny body of the doji candle illustrates indecision. During the formation of this candle, prices moved higher, and prices moved lower – but they ended up closing very close to where they had opened. The fact that traders couldn’t decide to bid prices higher or lower shows us indecision in the market, and this indecision can be an important turning point that, as traders, we might be able to take advantage of.
The Importance of Context with the Doji
Perhaps more important than the Doji itself is what else might be happening with price action leading into, or around the Doji formation. Because after all, the indecision of a Doji candle can only tell us so much, right?
If the currency pair is or has been trending into the Doji formation, this can be an excellent sign of a retracement, as the picture below illustrates.
The Doji can be a signal of a retracement

Created with Marketscope/Trading Station
While it would be optimal for each Doji printed to mean that we have a brief pause in the trend, so that we can re-enter before the trend continues, this will unfortunately not always be the case. And the reason for this is that indecision, and further, retracements – can last for much longer than one simple candle. The picture below will illustrate this premise:
The Retracement may extend past the Doji, as indecision may continue

Created with Marketscope/Trading Station
Multiple Dojis
To take the above concept a step further, when a doji may be simply the beginning of a retracement or period of indecision in the market; price action can show multiple dojis over a period of time. The picture below will illustrate:
Multiple Dojis may appear in a short period of time

Created with Marketscope/Trading Station
The multiple dojis are simply highlighting more-extended indecision. Think of price action leading up to a really big fundamental news event. Traders around the world know this event is going to happen, so there will often be reticence to bid prices significantly higher or lower. This indecision in the market place can be shown in the form of multiple dojis in a short period of time.
When the Doji Works Best
One of the prevailing themes in The Forex Trader’s Guide to Price Action is the fact that no formation, no indicator, and no trading setups offer 100% accuracy. So, traders are best served by assuming that future price action is unpredictable, and setting their trades up so that wins may benefit them more than losses may hurt them. This falls in line with avoiding The Number One Mistake that Forex Traders Make.
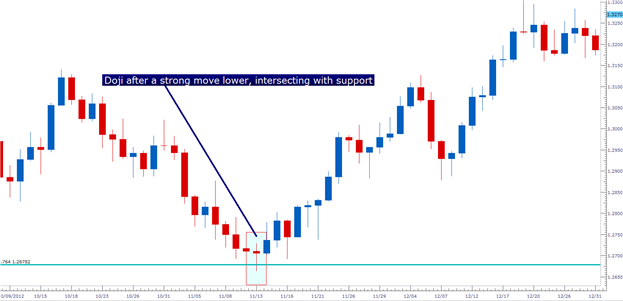
This is where the doji formation can be most advantageous; in situations in which traders may be able to gleam favorable risk-reward ratios. This can be done with the addition of support and resistance to highlight where traders these situations might present themselves.
Take, for example, the situation on EUR/USD in November of last year. After running from 1.3140 to 1.2700 in a little under a month, price intersected with a strong area of support (1.2678 is the 76.4% Fibonacci retracement of the major EUR/USD move from 1.1640 (11/15/2005) to the 1.6039 high (7/15/2008)).
After running so far, so fast, and upon intersecting into a strong area of support, indecision entered the marketplace in the form of the doji.
Created with Marketscope/Trading Station
Trading Reversals
Trading price reversals can be extremely attractive; even though it’s probably one of the more dangerous market conditions that traders can speculate in. Because if we’re trading a reversal, we’re looking for a trend to reverse; and that trend was taking place for some reason previously, so if left unchecked – the trader looking for a reversal may end up holding a losing trade that depletes their equity. So, first things first – if trading reversals, use strong risk management.
The above setup on EUR/USD was a textbook reversal that played out beautifully, but unfortunately, most reversals will not be so clean. Traders want to look to incorporate additional analysis into their repertoire to avoid the effects of reversals gone awry; a simple doji formation is not enough alone to trade a reversal.
In the example below, we move down to the 4-hour chart to investigate an entry in the same EUR/USD setup we examined a moment ago. This is called Multiple Time Frame Analysis, and we investigated this in the article The Time Frames of Trading.
Confirming a Reversal by moving down to lower time frame for entry

Created with Marketscope/Trading Station
In the above 4-hour chart, we get a much more granular look at the doji that was investigated in the previous example. Notice that no doji is showing on the 4-hour chart, and the reason for that is because the doji was on the daily chart; but that doesn’t mean the 4-hour chart can’t help us, because it can.
We can then incorporate other principals of price action, such as up-trends form continuous higher-highs and higher-lows.
On the 4-hour chart, we wait for the higher-low to be printed, and then we can look to enter shortly thereafter; placing a stop just below the low of the doji, and looking for a minimum 1-2 risk-reward ratio.
This way, if the reversal does pan out – the trader can profit handsomely. But if the reversal doesn’t take place, and the previous trend continues, the damage can be mitigated and the trader can use price action logic to get out of the position.
-- Written by James Stanley
James is available on Twitter @JStanleyFX
To join James Stanley’s distribution list, please click here.
Do you not yet feel comfortable reading and grading price action? Take this 20 minutes ‘New to FX’ course presented by DailyFX Education. In the course, you’ll learn about the basics of an FX transaction, what leverage is, and how to determine and appropriate amount of leverage in your trading.
Register here to start your Forex Trading Education.
We’ve recently begun to record a series of Forex Videos on a variety of topics. We’d greatly appreciate any feedback or input you might be able to offer on these Forex videos:


