


Article Summary: If you’re a trader who is looking to benefit from the market’s tendency to trend for long periods of time, then understanding the cloud may help your trading immensely. The cloud will tell the trend follower what they need to know. This article will help you determine if the trend is showing you an uptrend, downtrend, or range that isn’t worth trend trading on your respective time frame.
Many traders want to know how to make money when they approach a new market. That naturally makes sense, but there may be a better way. That better way would be that of learning how not to lose money and then build from there.
Learning to not lose money is really the other side of the same coin of trading successfully. Sadly, this side of the complete and logical trader coin is often sacrificed because it isn’t as exciting to study. However, if you can build from a foundation of not losing money then trading can be much more effective.
Learning How One Doesn’t Lose
What is a losing trade? To oversimplify the matter on purpose, a losing trade is held when your position is opposite of the market’s impulse or drive. Therefore, in a rising or up trending market, a short trade which only profits in a falling market, would be a losing trade.
How does this help the new trader? When you’ve identified the trend, you can greatly decrease your odds of losing by not trading against the trend. Trading against the trend is more enticing than it sounds because many traders want to buy the bottom or sell the top but I’d recommend against this impulse because neither you nor the next trader knows when the trend will end.
"The Market Can Remain Irrational Longer Than You Can Remain Solvent."
-John Maynard Keynes
How Ichimoku Displays the Trend
Ichimoku favors the visual trader. This is due to the cloud shown with Ichimoku which is often displayed on one side of price action. When price is above the cloud as shown below, the market is in a bull or uptrend and price below the cloud shows you a bear or downtrend.
Learn Forex: Price above the Ichimoku Cloud Gives You an Instant Picture of an uptrend

Learn Forex: Price below the Ichimoku Cloud Gives You an Instant Picture of a downtrend

You may notice above that different time frames are used to display the uptrend (shown by a blue cloud) on the first chart and a downtrend (shown by an orange cloud) on the second chart. The reason for this is very simple. Traders often use different time frames for trading and Ichimoku can be used on the time frame or instrument of your preference. A trend on a 30 minute chart is still clearly displayed to a short term trader while being altogether ignored by the long term position trader who is also trading with Ichimoku and that is OK.
Ichimoku doesn’t have to be the only indicator you use for your trading strategy. However, simply applying and starting with the cloud on the chart of your choosing can help you stay on the right side of the current. By staying on the right side of price action, you’ll clearly identify where the losing trades are likely being placed (against the trend) so you can avoid the trap of trying to buy a bottom or sell a top.
Ichimoku Weekly Trade: Sell GBUSD as GBPUSD Has Continued Below Cloud
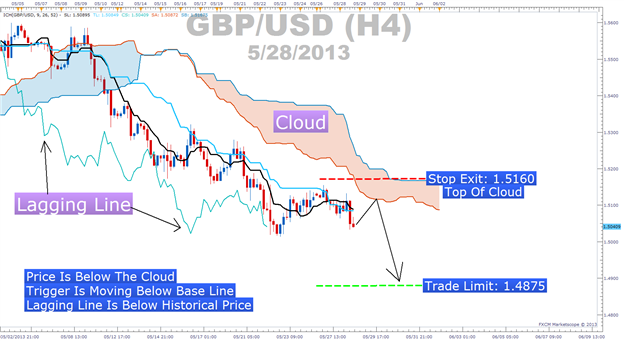
Ichimoku Trade: Sell GBPUSD Based on Price Bouncing
Off Ichimoku Resistance
This trade has the Trigger Line Signal working to break below the signal line
Stop: 1.5160 (Resistance with Top of Cloud)
Limit: 1.4875 (Profit Target Greater In Pips than Stop Exit & At Weekly S2 on Classic Pivot)
If this is your first reading of the Ichimoku report, here is a recap of the traditional rules for a sell trade:
-Price is below the Kumo Cloud
-The trigger line (black) is below the base line (light blue) or is crossing below
-Lagging line is below price action from 26 periods ago
-Kumo ahead of price is bearish and falling (red cloud = bearish Kumo)
-Entry price is not more than 300 pips away from base line as it will likely whip back to the line if we enter on an extended move.
Ichimoku is best used to spot good entries in the direction of a strong trend. On the chart above, any temporary strength of GBPUSD has been followed by solid selling pressure providing a signal that price is too weak to move higher for a sustained period of time.
Happy Trading!
Prior Ichimoku Articles:
Trading Ichimoku on Smaller Time Frames
Is Ichimoku A Leading Or Lagging Indicator?
Using Ichimoku Levels to Get the Most of a Trend
---Written by Tyler Yell, Trading Instructor
To be added to Tyler’s e-mail distribution list, please click her e.
Would you like dozens of trade ideas every day with updated charts to identify major levels support and resistance on the currency pair you’re trading?
If you’d like to learn more about our Technical Analyzer on DailyFX Plus, click here.


