


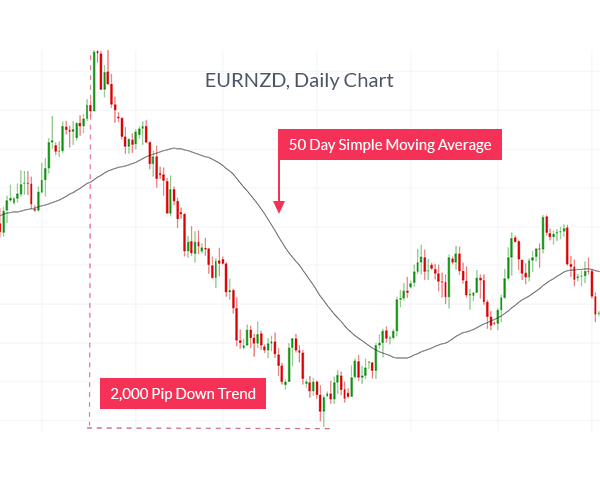
You know that the right trend can make your month or year as a trader. Who can blame traders for wanting to hunt for trends? We do not and we certainly recommend you take advantage of clear trends like the EUR/NZD below when trends presents themself.
However, as a trader, you must be familiar with how to identify a false breakout over a legitimate break out. Many traders try and force trend entries when a breakout occurs even though the market has no intention of honoring that breakout. Any trend follower is familiar with the feeling of entering into a bad trade when they prematurely entered into a trade. It feels like a trap.

It’s time that you come to grips and learn how to tell if a breakout is real or if you should fade the breakout and take advantage of the great risk: reward ratios that are available when you notice a false breakout.
This article will help you to take advantage of false breakouts that experienced traders love to trade and that trap new traders.
Here are the tools we’ll use to protect ourselves against getting trapped into a false breakout.
- Average True Range (14 periods)
- Support & Resistance
- Candlestick Analysis
Here’s what it will look like on your screen:
Average True Range (ATR)
The average true range indicator allows you to see the volatility behind the pair you’re trading by measuring daily moves. You can use ATR to test the validity of a breakout when price pierces support or resistance. The reason we use the ATR is to determine the amount of pips the range must be broken by before we enter into the trend or decide to fade the breakout. As an example, the ATR (14) for AUD/USD is 68.0 pips as of today’s reading. The ATR (14) for GBPJPY is 114.6 pips. This tells you that the GBPJPY is 2X more volatile in pip terms than AUDUSD. We would look for a breakout from a range above 68 pips and 114.6 pips respectively before we enter with the new trend. If this doesn’t occur we look to take a high probability trade back into the newly expanded range with a strong money management system.
Rule One of trading false breakouts is that if price doesn’t break the range by the ATR, the breakout is false and we should fade the overextended move. If the pair pushes through by more than the ATR then we are looking at a legitimate trend to follow that should now be on our watch list.
Support & Resistance
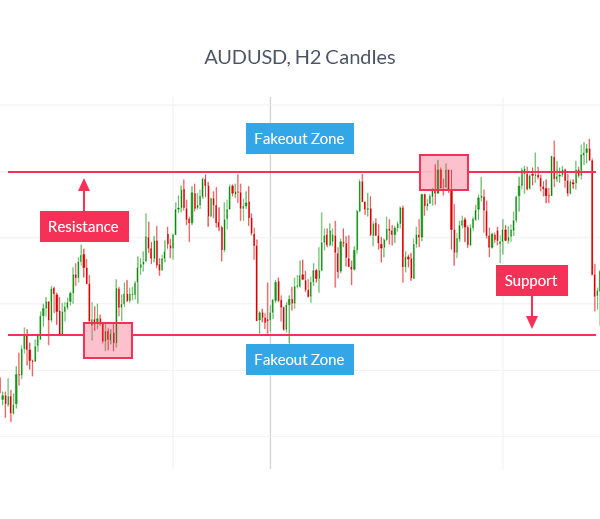
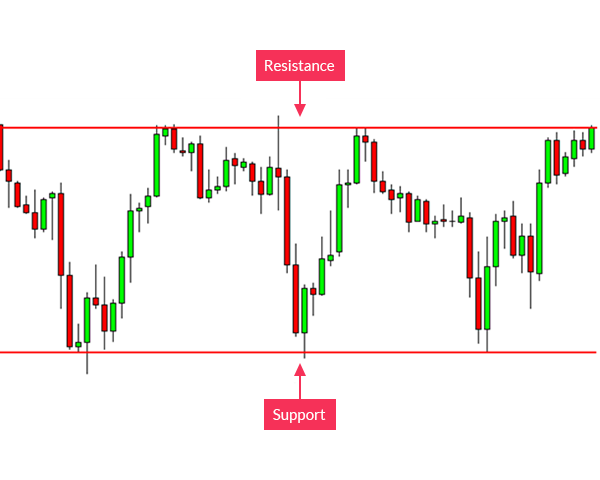
As time goes by, traders focus more on support and resistance for one reason. The market focuses on support and resistance. You should too when determining a new trend or an expanded range. Support is seen as the floor that price rests on before shooting back up. Resistance is the ceiling that price reaches before revising back to the price range. If a new trend breaks out to the upside, then what was resistance now becomes support.
Support and resistance do not require an indicator but an eye to look at the chart and see when buyers stop buying in an uptrend or sellers stop selling in a down trend. We also recommend you treat them like a flexible fence as opposed to a glass floor or ceiling that will be shattered if pierced.
How this applies to false breakout trade: If you recognize a false breakout below support, you can enter a buy entry near support (range low) and you can adjust trade size so that should the market reverse and move back below support to hit your stop, no more than 2-5% is risked on the trade. Finding respected levels of support and resistance is very helpful in finding high-probability trades.
Many professional traders feel that trading ranges is a higher probability set up and that because following trends is tempting but has a low probability play out, they’re better off sticking to ranges.
Candlestick Analysis
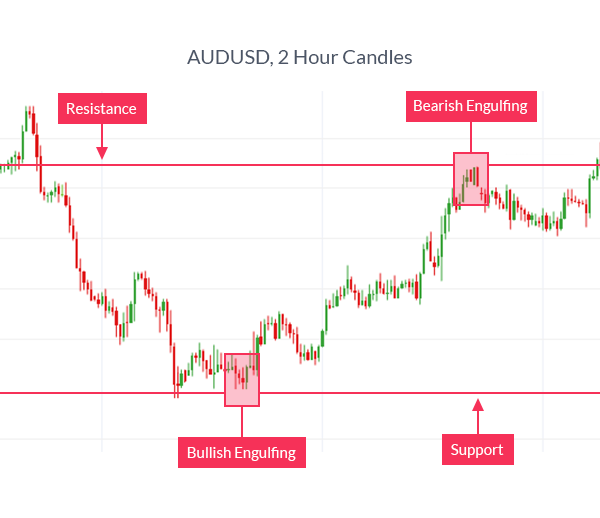
Few methods are as valid and time tested as Candlestick analysis. Candlesticks allow you to see real-time market sentiment so that you can identify tipping points as they’re developing. Sentiment is important for you to know so you can see when buyers are heading for the exits when a supposed upside breakout occurs. Similarly, you can look at candles around support to see if sellers have lost confidence and are not willing to hold on to their trade. This allows you to take advantage of the false breakouts in real-time.
The two signals we see here are the Bullish & Bearish Engulfing signals which are two very strong reversal signals at very important points on the chart. As a side note, candlestick patterns take on a critical importance around support and resistance or against major pivot levels or moving average levels because this is where sentiment of traders are key.
Knowledge of false breakouts and how to trade them appropriately with ATR, Support and resistance, and Candlestick analysis can add a lot to your trading. Remember to always be patient and when you see price alerting you to a new trend or a false breakout, you will now how to approach it with confidence.
Happy Trading.
Next: Breakout Entries for Ranging Markets (37 of 50)
Previous: A Basic Indicator Breakout Strategy
---Written by Tyler Yell, Trading Instructor
To contact Tyler, email tyell@dailyfx.com
To be added to Tyler’s e-mail distribution list, please click here.


