


When trading in markets, it is often beneficial to have a strategic approach. While the concept of trading on hunches and whims – and being profitable doing so, may sound attractive; in practice it is much more difficult and far less likely than if one had a formulaic approach with which they look to speculate in markets.
There are many ways of doing this. This article will walk through the primary areas that traders want to look to when building their strategies.
Before the strategy is ever created, the trader first needs to decide which market condition they are looking take advantage of. In the first part of our How to Build a Strategy series, we looked at this topic in detail. And as we saw, markets will display 3 primary conditions: Trend, Range, and Breakout (as shown in the illustration below).

Created with Marketscope/Trading Station
Each of these market conditions can exhibit markedly different tones. Ranges can commonly take place during quiet markets. The support and/or resistance that define ranges become broken when price breaks out, often from some form of news or stimuli.
Breakouts can be fast and furious, running quickly to a traders stop or limit. Breakouts can be extremely volatile, and as such, these strategies need to be built differently than range or trend strategies in regards to money, and risk management.
Once a bias has begun to set in the market, longer-term trends can develop. Once again, this is a unique condition that necessitates an approach different than range or trending markets.
Once a trader has decided which market condition they want to build their strategy for, they then need to decide which timeframes they want to analyze and execute their trades on. In The Time Frames of Trading, we explored the more common intervals that traders may want to investigate based on desired holding times.
We went further to explore the concept of Multiple Time Frame Analysis, in which traders can use a longer-term chart to gauge the general trends or sentiment that may exist in a currency pair; and then using a shorter-term chart to get a more granular look as they enter the trade.

Multiple Time Frame Analysis Intervals; prepared by James Stanley
Entering the Trade
The next step in building a strategy is to begin to design how the trader will be entering trades. As we looked at in Grading Market Conditions, support and resistance can define ranges, thereby defining breakouts while also offering quite a bit of assistance with risk management in trend-based strategies.
As such, it can often benefit the trader by having multiple mechanisms for pointing out which of these levels may or may not be pertinent. In How to Build a Strategy, Part 3: Support and Resistance, we looked at Price Action, Psychological Whole Numbers, Fibonacci, and Pivot Points.
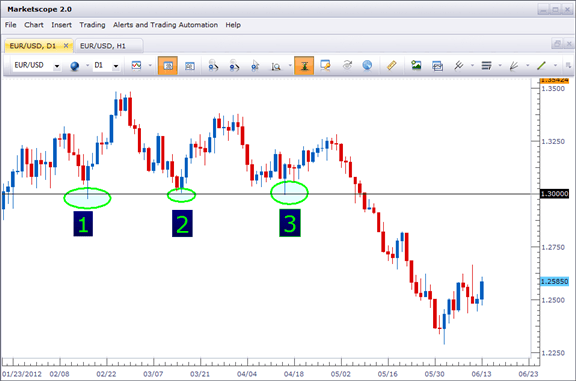
EURUSD interacting with the 1.30 level/Created with Marketscope/Trading Station
After a trader has decided on the mannerisms of support and resistance to be utilized in the strategy, they then need to find a way to grade the strength of price moves. In How to Build a Strategy, Part 4: Grading Trends, we tied together some of the earlier concepts of price action, multiple time frame analysis, and market conditions to help traders see that they can grade how ‘strong’ a trend has been.

(Created with Trading Station 2.0/Marketscope)
Risk Management
In How to Build a Strategy, Part 5: Risk Management, we looked at what many traders consider to be the most important part of creating, trading, and maintaining a trading approach; and that is the manner in which traders are managing risk.
Much of this part of the series was based around the research performed by DailyFX in the Traits of Successful Traders research study.
In the DailyFX Traits of Successful Traders series, actual results from real traders on over 12 million trades were analyzed in an effort to find what had worked best, and how traders could work towards those results.
We looked at the fact that while many traders may win more often than they lose (with a winning percentage greater than 50%), it was the amount of their gains and/or losses that would often predicate their success or failure in markets. We then went on to talk about using risk-to-reward ratios in which the trader stands to make more if they are right than they could lose if they are wrong. The picture below will show a 1-to-2 risk-to-reward ratio:
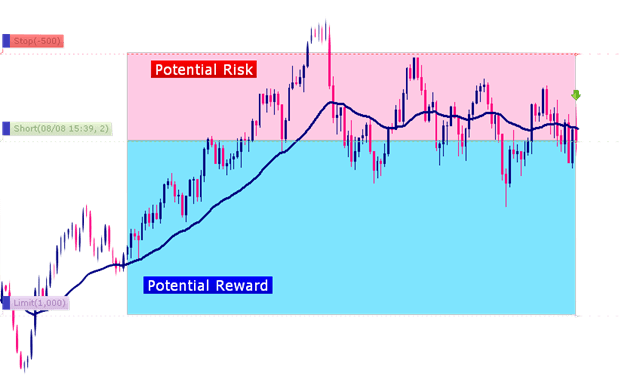
1-to-2 Risk-to-Reward Ratio
We then went on to investigate the concept of leverage, as outlined in How Much Capital Should I Trade Forex With, by Jeremy Wagner. This was the 4th and final installment of the Traits of Successful Traders series, and provides some very insightful information.

Taken from ‘How Much Capital Should I Trade Forex With?’ by Jeremy Wagner
From the graph, we can see that traders with larger balances (between $5,000 and $9,999) used lower levels of leverage (shown on the bottom of the graph); and these lower levels of leverage allowed for greater profitability.
Traders using leverage of 5:1 were profitable 37.37% of the time, while traders with balances below $1,000 were using, on average, 26:1 leverage – and were only profitable 20.91% of the time. This is a massive deviation, as traders using a moderate 5:1 leverage ratio were profitable 78% more frequently than traders using 26:1 leverage.
The thesis of the 4th installment of the Traits of Successful Traders series
suggests that ‘traders should look to use an effective leverage of 10-to-1 or less.’
When to Execute Your Strategy
Up to this point, we have covered many of the areas that traders would want to look to when building their strategies. Perhaps as important, if not more so – is when we will actually be trading the strategy that we are creating.
One of the key differentiators of the FX Market is the fact that it doesn’t close. We discussed this topic in detail in the article ‘Trading the World.’

Charting the 24-hour nature of the FX Market; from Trading the World, by James Stanley
Although the market is open 24 hours a day, price action can take on markedly different ‘tones’ based on what time of the day it is, and where liquidity is being offered from.
For instance, the Asian session is generally considered to offer slower price action, with stronger adherence to support and resistance and less potential for ‘big moves.’ Because of this, traders looking to execute range-based strategies may be better served by focusing their entries on the Asian session.
At 3AM ET, liquidity begins coming in from London, which many traders consider to be the ‘heart’ of the FX Market. London is the largest market center, brings in the most liquidity, and shortly after the open –large moves can often be witnessed on the major currency pairs. Traders that were previously executing range strategies in the Asian session would want to be cautious here, as support and resistance can be broken much more easily with the onslaught of liquidity coming from London. Traders executing breakout strategies can often find the fast and volatile markets they are looking for after the London Open.
At 8AM, as the United States opens for business even more liquidity flows into the FX Market. This period is considered the ‘overlap,’ when both London and New York market centers are trading; and this is often the most voluminous period of the day in the FX market. Fast moves can be abundant, volatility extremely high, as the potential for reversals can denigrate even the strongest range strategies.
After London closes for the day, the flavor of the US Session can change quite a bit. Average hourly moves can decrease, and price action can begin to wane. The US Session may take on overtones of what is generally exhibited in the Asian session: slow price moves accented by a greater degree of respect for previously defined support and resistance levels.
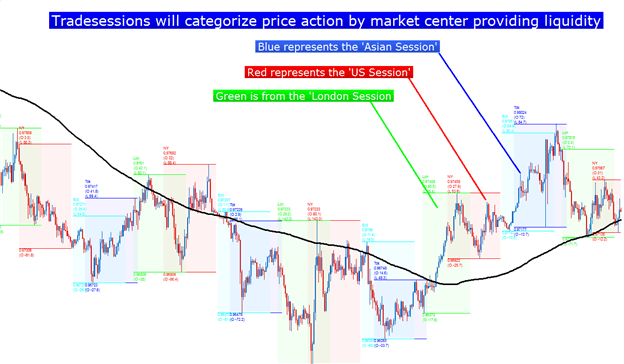
Tradesessions custom indicator for Trading Station
Forex Strategy FAQs
When are the best times to tade forex when implementing a volatility focused strategy?
Major currency pairs tend to exhibit greater volatility when two trading sessions overlap. The reason for this is because there are more participants trading forex, meaning greater volume of trade and more volatility. For a better understanding of when trading sessions overlap, read our FX 24 Hours a Day article.
I don't know what type of trader I am, how can I find out?
Whether you are New to FX or a seasoned veteran, traders will have different styles and preferences. These often vary based on how long you spend in the market, how you analyse the market (technical vs fundamental analysis) and whether you place trades your self or make use of automatic trading. If you are usure what type of trader you are, we suggest you read Trader Styles and Flavors.
--- Written by James B. Stanley
You can follow James on Twitter @JStanleyFX.
When is the Best Time to Trade Forex
Here is How to Trade Forex Majors like EURUSD during Active Hours
How to Analyze and Trade Ranges with Price Action
How to Build a Strategy, Part 1: Market Conditions
How to Build a Strategy, Part 2: The Time Frames of Trading
How to Build a Strategy, Part 3: Support and Resistance


