


Long Wick Bounce
One way to catch potential tops and bottoms is to look for long wicks. Often times, when the market “turns”, a large wick will form at a significant support or resistance level. Buyers and sellers quickly emerge at these extremes and the market then reverses. Traders can then use these lows or highs from the wick candle as a basis for their entry level and stop.
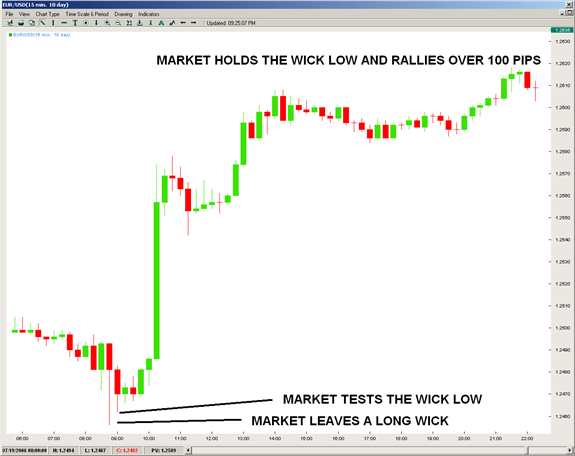
This strategy can be applied to any time frame. The key is the length of the wick. As a general rule, the wick should be at least 15-25 pips. One of the main benefits of applying this strategy to shorter term charts, such as a 5 minute, is that the price extreme of the wick, by definition, will not last very long. In other words, in order for a long wick to form on a 5 minute chart, the move to the price extreme and subsequent reversal must occur within a 5 minute time span. Long wicks on any time frame indicate that prices are not comfortable at a certain price level, while long wicks on a 5 minute chart indicate that prices were very uncomfortable at the extreme and quickly reversed.
Trendline Third Touch
It has been my experience that the third point of a trendline usually represents the best trading opportunity. This strategy can also be applied to shorter term charts. I would suggest an hourly chart as the shortest time frame. As with any support and resistance line, the more times a trendline is tested, the more likely it is to break or fail. So, while a trendline with 5 points is easily defined, chances are it will soon fail. The third point however is the first time that the new trendline (with two previous price points) is being tested. This usually represents the “strongest” point of the entire trendline. In other words, the third price point of a trendline is usually the most reliable area of support or resistance in my opinion.

The main benefit in terms of trading with trendlines is that we can have a very specific price point to base the trade around. For example, if we calculate trendline support at 1.2670, we can wait until prices hit 1.2675 (5 pips above support) and place a stop just a few pips beneath the support level, I would suggest 10-20 pips beneath support as a general rule. This will create a very favorable risk to reward ratio and a clearly defined trade.
Matt Russell regularly contributes to the Instructor Trading Tips and records a nighlty trading Video with specific trade set ups called London Calling. To receive more timely notifications on his reports and videos, email instructor@dailyfx.com to be added to his distribution list.


