


Talking Points
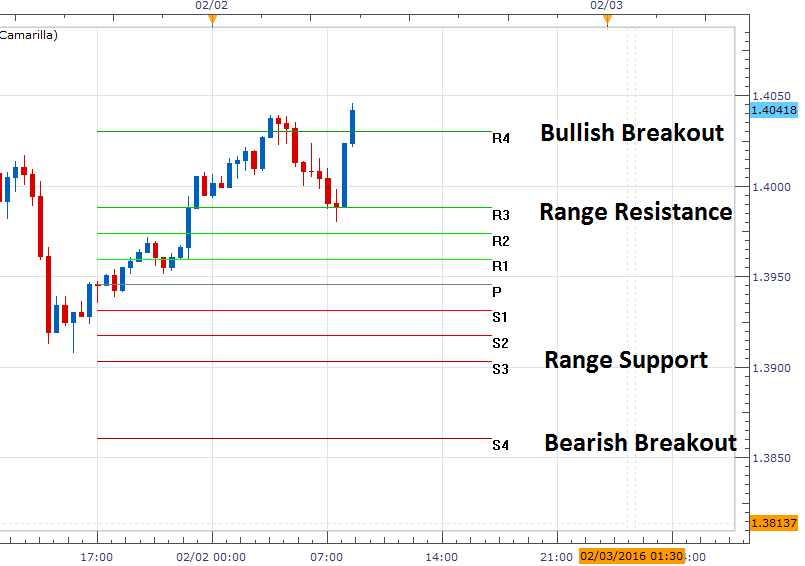
- The USD/CAD attempts breakout over 1.4030
- Potential bullish targets include a 1-X range extension to 1.4105
- Bearish reversals begin under 1.4086
(Created using Marketscope 2.0 Charts)
What is in store for the US Dollar in 2016? See our Analyst forecast here !
The USD/CAD is attempting to breakout to a higher high this morning, potentially ending the range bound conditions that have been developing for the last five trading periods. Today’s bullish breakout is marked by the R4 Camarilla pivot point, which is found at a price of 1.4030. In the event that prices continue to rise above this value, traders may extrapolate today’s 85 pip trading range to place initial breakout targets near 1.4105.
Breakout traders should continue to monitor the R3 pivot point found at 1.4086. A move in price back inside of range resistance would suggest that the current breakout attempt has been invalidated. It should be noted at this point that the USD/CAD has already failed one breakout attempt today. In this scenario, traders may look for bearish momentum to carry the pair back towards values of support. This includes today’s R3 pivot, which is displayed above as range support at 1.4041.
SSI (Speculative Sentiment Index) for the USD/CAD currently reads -1.34. Currently 57% of positions are short, suggesting a bullish bias for the pair when read as a contrarian-trading indicator. While SSI has swung from extremes earlier in the month, it should be noted that the Index has read negative for the USD/CAD since November of 2015. For this reason, traders watching for a bearish reversal should continue to monitor this value for a flip in the SSI reading to a positive value.
To Receive Walkers’ analysis directly via email, please SIGN UP HERE
See Walker’s most recent articles at his Bio Page.
Do you know the biggest mistake traders make? More importantly, do you know how to overcome the biggest mistake? Read page 8 of the Traits of Successful Traders Guide to find out [free registration required].
Contact and Follow Walker on Twitter @WEnglandFX.


