


Talking Points:
- The Benefits of Multi-Time Frame Analysis
- Multi-Reversal Box Analysis Allows P&F Multi-Frame Analysis
- Key Signals From 1-Box & 3-Box Signals
Point & Figure is a charting method to help you decipher the signal from the noise in price action. You were introduced to the construction of the charts and logic in the most recent article. However, the advent of the computer have brought focus on real-time charts which can have bring more noise than signal.
The Benefits of Multi-Time Frame Analysis
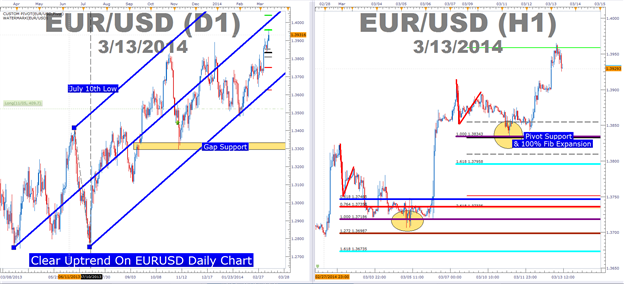
Many traders have become fond of Multi-Time Frame (MTF) analysis. The basic premise is that if the daily trend is up like we see on EURUSD, then you should look intra-day for entry’s higher.
Learn Forex: EURUSD Daily Paves the Way for Smaller Time Frame Trades
Courtesy of Marketscope 2.0
You can see EURUSD above shows a Daily chart left of an hourly chart. A lot of traders like to use smaller charts because it helps them to look inside the daily candles. Using the example above, because the daily trend is higher, traders should be looking for dips as potential buying opportunities on the shorter term charts. EURUSD recently bounced nicely off the weekly pivot as well as a key Fibonacci level which can give you confidence on your trade entries.
Moving back to Point & Figure charts, there are two common types of charts. The 3-box reversal chart is akin to a daily chart except it only prints a new column or mark when a breakout occurs and the 1-box reversal chart could be similar to the hourly chart or smaller. Therefore, we can use these different charts to complement each other and help you devise trading signals apart from the noise.
For purpose of all charts, I utilize Average True Range as my Point & Figure box size. Therefore a 1-box reversal chart or a 3-box reversal chart will be a 1(ATR) X 1 P&F chart or a 1(ATR) X 3 P&F chart.
Multi-Reversal Box Analysis Allows P&F Multi-Frame Analysis
Combining multiple reversal box analysis can provide two key benefits. First, you get the original benefit of Point & Figure charts that help you to ignore the price ranges that chew up the equity of traders in trendless markets. Second, you can use the smaller-reversal box chart (1-Box reversal) to see when a current trend is near resumption if you want to reallocate capital to higher probability opportunities.
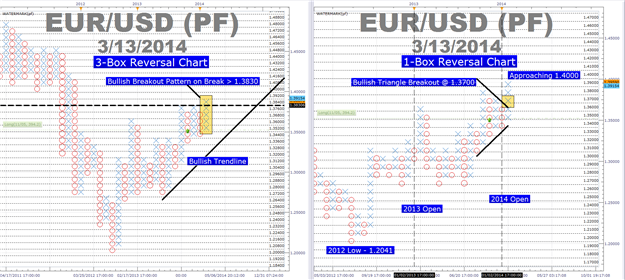
Learn Forex: 3-Box vs. 1-Box EURUSD P&F Signals
Courtesy of Marketscope 2.0
To get a grasp of how each chart can be useful, here’s a quick breakdown. 3-box reversal charts allow you to have a more objective view with objective patterns, trends and targets. The 1-box chart allows you to see a more flexible chart with the restrictions of Point & Figure but to a lesser degree but the analysis is a more subjective similar to an hourly chart being a bit more subjective than a daily chart.
Key Signals from 1-Box & 3-Box Signals
3-Box reversal Point & Figure signals are simple. You’re predominantly looking for bullish control by breaking through prior resistance or bearish control by breaking through prior support. On a candlestick chart, this is known as a double-top or double-bottom breakout.
Another popular breakout or signal on Point & Figure chart is a breakout from a triangle similar to the one seen on the right chart below. As you now well know, a breakout in Point & Figure mean more than candlestick charts as it takes a breakout from a 3 multiples of ATR against the prior trend in order to register a breakout.
Learn Forex: 1-Box vs. 3-Box Reversal

Courtesy of Marketscope 2.0
1-box reversal point & figure charts have a few key signals that are easy to recognize and can confirm the prior trend when recognized. 1-box reversal can be more subjective because the chart can reverse without nearly as much price action as a 3-box reversal point and figure chart. However the fulcrum is the main signal that helps you recognize reversals where semi-catapults help you recognize continuation of a prior trend.
Learn Forex: 1-box Semi-Catapults & Fulcrum Signals

Courtesy of Marketscope 2.0
The name of the 1-box signals help you visualize their purpose. The fulcrum, above on the left, helps you see when price pivots away from the direction of the prior trend and is a reversal signal. The next signal for the 1-box chart is the continuation signal known as a semi-catapult. Because 1-box charts only have 2 signals, or one for reversals and one for trend continuation, you can see how these type of charts can simplify your trading.
Summary
The reason why Point & Figure charts have stood the test of time can be summed up in the word, simplicity. The 3-box chart keeps you looking for double-top or double-bottom breakouts or breakouts out of congestion. The 1-box P&F chart keeps you looking for semi-catapult trend continuation signals or fulcrums as a trend reversal signal.
Point & Figure doesn’t have to replace your current charts. However, P&F can provide a calm assurance that the breakout your trading is legitimate or help you see whether it is worth buying a low or selling a high price level. As usual, it’s best to keep an eye for reversals higher before trying to buy low or reversals lower before trying to sell high.
Happy Trading!
Point & Figure Introduction – I of IV
---Written by Tyler Yell, Trading Instructor
To contact Tyler, email tyell@dailyfx.com
To be added to Tyler’s e-mail distribution list, please click here
Tyler is available on Twitter @ForexYell
Become a Smarter Trader Today
Claim your FREE universal membership to DailyFX Internet Courses & save yourself hours in figuring out what FOREX trading is all about.
You'll get this FREE 20 minute “New to FX” course presented by DailyFX Education. In the course, you will learn about the basics of a FOREX transaction, what leverage is, and how to determine an appropriate amount of leverage for your trading.


