


Talking Points:
- The S&P 500 is trading at new highs.
- GBPJPY is highly correlated to the S&P 500, but has not broken out of a triangle.
- GBPJPY has just rebounded from the daily 23.6% Fibonacci level which is bullish.
Since the low of 137.81 in January 2013, GBPJPY has rocketed over 3700 pip hitting a high 174.82 before taking a breather. The orderly 3-wave decline terminated in the area of the 23.6% Fibonacci zone between 163.76 and 166.09. The spectacular move can be attributed to stronger UK economic fundamentals and a weaker Japanese yen. The question remains, what will pound-yen do for an encore? The answer may rest in the symmetrical triangle chart pattern and Fibonacci.
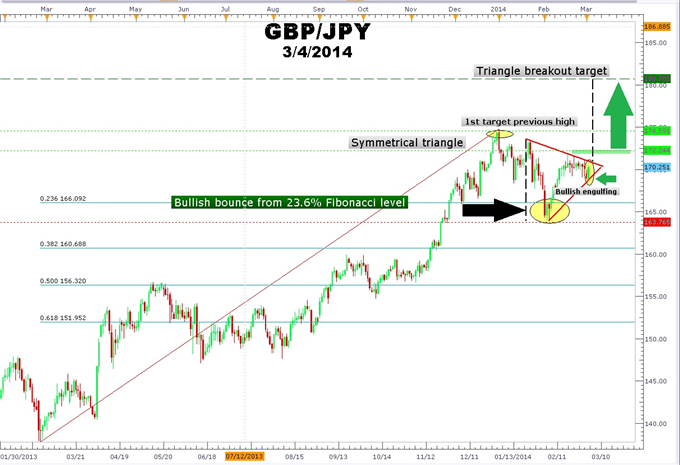
Learn Forex: GBPJPY Daily Chart Symmetrical Triangle
Created with Marketscope 2.0
Usually, a symmetrical triangle has no trading bias as the bullish and bearish forces that are contained between the converging red support and resistance lines are said to be balanced. However, notice in the chart above that the recent decline from the January 2014 highs rebounded strongly and without hesitation from the 23.6% level. This aggressive move shows that traders were not willing to wait for a bigger correction to buy GBPJPY at a discount. Instead, buyers jumped on the dip after the overshoot of the 23.6% level. There is bias for the triangle to break north combined also with a bullish engulfing candlestick pattern on the same daily chart.
A breakout above the 172.24 would confirm a move higher toward the New Year’s highs. In addition, the measurement of the height of the triangle can be used to project a minimum price objective of 180.70. On the other hand a close below the 163.76 February low would signal a pattern failure. A move to the 61.8% Fibonacci level would be the next stop at 151.95 which was also a 5-month long consolidation. With the S&P 500 at historic highs and GBPJPY yet to breakout, another 1000 pips is possible based on the symmetrical triangle target objective.
---Written by Gregory McLeod Trading Instructor
This article showed you how to use Fibonacci to trade GBPJPY bounce. I want to invite you to enroll in our free Fibonacci Retracement Course to further your understanding of Fibonacci. Sign our Guestbook to gain access to this course. You will automatically have universal access to other courses.


