


Talking Points
- Many Retail Traders Are Short S&P500
- Historical Rallies Have Far Surpassed The Current Rally
- SPX500 corrections have been shallow and denote underlying strength
" If you trade Countertrend, you are gambling, and although you will often win and have fun, the math is against you, and you will slowly but surely go broke. Countertrend setups in strong trends almost always fail and become great With Trend setups..."
-Al Brooks, Reading Price Charts Bar by Bar
The current equity rally has been dubbed my many as one of the most hated stock rallies in recent history. The reason for the rally’s despise by the trading public likely has more to do with the media and unprofitable hedge fund managers who argue that the market is wrong and should be vastly lower . However, as we end 2013, the SPX will end a top-10 year despite its critics and looking a history, this rally could continue.
Retail Traders Are Short SPX as the Trend Looks Strong
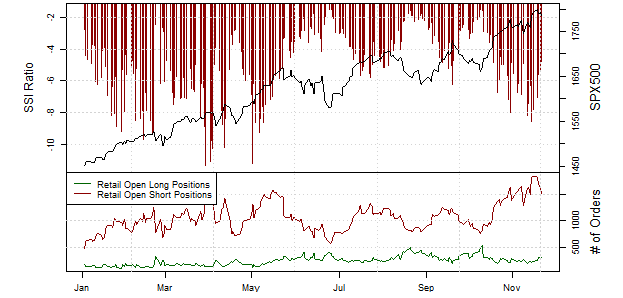
Courtesy of dailyfx.com/technical_analysis/sentiment
Trader sentiment is a favorite tool of the DailyFX faithful to see when a FX market is being aggressively denied by retail traders. While we hope that traders on the whole were more successful, our Traits of Success Forex Traders report clearly showed that retail traders aggressively fade strong trends or add to their losing trades against the trend. The report covered 12 million live FXCM account holder trades and made the obvious point that when the retail crowd is extremely negative towards a specific trend, that trend can and likely will continue to the disappointment of many traders.
Looking above, you’ll see a line price chart of the SPX500 with an overlay of retail positioning where a current reading of -6 shows you that there are 6 traders short for every one trader long on the FXCM order book. A -6 reading clearly displays an overwhelming attempt by traders to call a top to the SPX500. Sadly, as you can see above, retail traders have been net short for all of 2013 as the SPX500 has rallied 26.5% YTD for over 400 points.
Bottom Line: Trading with the retail crowd is a risky strategy as the crowd will aggressively look to call a top months or years before the event comes to pass. The SPX500 is a strong trend that is likely best to either be long or flat but not short.
Historical Rallies Have Far Surpassed the Current Rally
There is a massive list of cognitive bias’ that are important to fight off as you look to build up your trading account. The two that I believe must be fought most aggressively is overconfidence which breeds over trading your account and not thinking like a pro and the recency bias. The recency bias states that you most easily recall and expect a repeat occurrence of something that recently played out. In terms of the stock market, many have been looking for a repeat or worse of the 2008 equity market crash.
With the event of the 2008 market crash and following great recession in mind, many traders feel like the market “is due” for a correction / crash because of how far the equities market has move from the March 9th, 2009 low. However, if you go back past the 2008 global credit crisis and subsequent equity market crash you’ll realize that the SPX500 has had rallies that have far surpassed what is currently in play.
Long-Term view of SPX500 Shows Prior Rallies
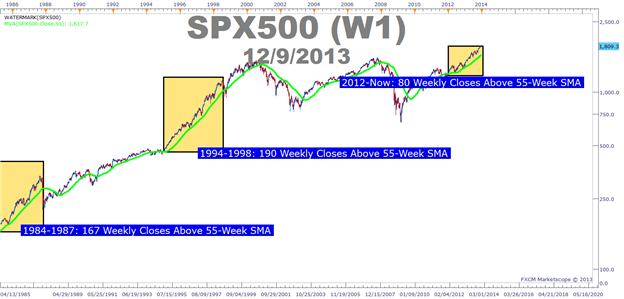
Presented by FXCM’s Marketscope Charts
Corrections on the SPX500 have been relatively shallow as major institutions are putting too much belief into a downside move as seen few if any lower highs and lower lows on the charts. Price in relation to the 55-week moving average is rather telling when you look at historical rallies. The current rally going back to late 2012 has had weekly closes above the 55-week moving average for nearly 80 weeks.
However, if you put your recency bias aside, you’ll see that the SPX500 closed above the 55-week moving average for 167-weeks going into the 1987 crash and consequently 190-weeks going into the summer 1998 high. Therefore, recency bias may have you thinking that a crash is around the corner but prior bull markets show that this rally could go on for another few years.
Bottom Line: Judging the SPX500 by historical standards and not the most recent major correction shows that this rally could have much further to run before running out of steam. Therefore, trading against this long term trend could be disappointing and costly.
SPX500 corrections have been shallow and denote underlying strength
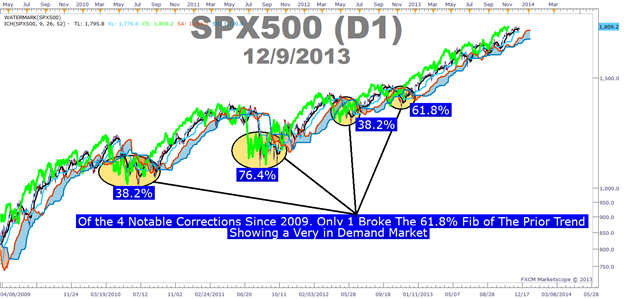
Presented by FXCM’s Marketscope Charts
The strength of an overall trend can often be discovered through corrections. The SPX has had its share of sell-offs since the 2009-low but most have been well contained and only one correction tested the Fibonacci level of last resort, the 76.4% before resumption of the trend. What’s more, the cause of that correction was the government shutdown and debt ceiling crisis in 2011 which caused XAUUSD to spike to $1920 per oz. before the fear market ensued. As you well now know, we had a repeat of that fundamental story in Washington DC this October but the correction was shallow and was followed by all time-highs in the SPX500.
Bottom Line: Corrections can often tell you how strong the trend is and how much conviction traders have who are going against the trend. The shallow and sideways corrections that the SPX500 has experienced over the last 4 years and specifically this year shows it’s best to stay either be bullish or flat, but fading this trend is a low probability play.
Happy Trading!
---Written by Tyler Yell, Trading Instructor
To contact Tyler, email tyell@dailyfx.com
To be added to Tyler’s e-mail distribution list, please click here.
Become a Smarter Trader Today!
Claim your FREE universal membership to DailyFX Internet Courses & save yourself hours in figuring out what FOREX trading is all about.
You'll get this FREE 20 minute “New to FX” course presented by DailyFX Education. In the course, you will learn about the basics of a FOREX transaction, what leverage is, and how to determine an appropriate amount of leverage for your trading.
You can instantly register for free here to start your FOREX learning now!


