


Talking Points
- Traders can use Candlestick patterns to modify their strategy to price action clues.
- The Three Inside Down pattern can confirm new market breakouts
- This pattern can signal an opportunity to take profits or place new market entries
Understanding candlestick charts continues to be the backbone of price action analysis for the Forex market. Once traders understand the basics, they can then begin to compile a series of candles to form patterns to confirm potential changes and market direction. Often candle patterns are also used to confirm an existing idea. Today we will review the Three Inside Down pattern and how it can be used in your trading.
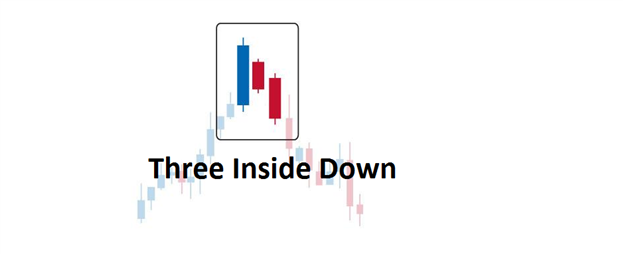
Three Inside Down Pattern
TheThree Inside Down candle pattern is actually a continuation of the Harami. Pictured above,we can see that this pattern is broken into three distinct candles. First again we have a large engulfing candle. This blue candle represents the end of bullish momentum as trading pauses with an inside bar creating the Harami. The third candle confirms the markets new downward bias with price breaking to lower lows. Not only should the body of candle number three closes below the second candle, It should close beneath the first candle as well.
This pattern is considered a strong candle for the fact that traders get an extra candle for market confirmation. As price moves toward lower lows traders can then look for new selling or retracement opportunities.
Let’s look at a current example.
Learn Forex – AUDUSD Daily & Three Inside Down

(Created using FXCM’s Marketscope 2.0 charts)
Uses in Trading
Above we can see an effect Three Inside Down pattern on the AUDUSD daily graph. After a strong bullish move, the AUDUSD consolidated with an inside candle. The third candle confirmed the markets direction, with a break of price support. After its creation, the market put in its current high then quickly descended 556 pips to for a higher low on the chart.
Traders looking to take advantage of the Bullish Three Inside Down pattern can add it into any existing trending market plan to identify changes in market direction. Traders may even trade independently it with an inside bar breakout strategy. Regardless of the method taken, traders should track their progress with a tr ading journal and periodically review how candle analysis is working in their trading.
---Written by Walker England, Trading Instructor
To contact Walker, email instructor@dailyfx.com. Follow me on Twitter at @WEnglandFX.
To be added to Walker’s e-mail distribution list, CLICK HERE and enter in your email information.
New to the FX market? Save hours in figuring out what FOREX trading is all about.
Take this free 20 minute “New to FX” course presented by DailyFX Education. In the course, you will learn about the basics of a FOREX transaction, what leverage is, and how to determine an appropriate amount of leverage for your trading.
Register HERE to start your FOREX learning now!


