Article Summary: Moving Averages are an important tool for technical traders to master. Learn the basics of how to read and use Simple Moving Averages in your Forex trading.
Technical traders are given a variety of options when it comes to finding the trend. One of the most commonly used applications across markets for this purpose is the simple moving average (MVA). Traders will use their interpretation of the market to then decide if they should buy or sell a specific currency pair.
Let’s take a look at how to interpret these averages to gain a leg up in identifying market direction and momentum.
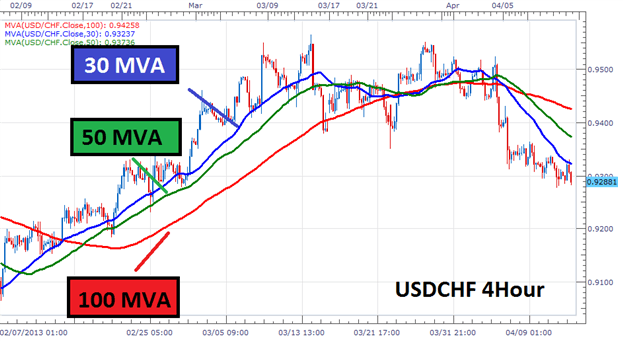
Learn Forex – USDCHF with MVAs

Interpreting Moving Averages
The graph above depicts some of the most commonly used Moving Averages in Forex. This includes the 30 (Blue), 50 (Green) and 100 (Red) period MVA. These Simple Moving Averages are created by finding the average close price for the specified number of periods selected. For instance to find the value of the 30 MVA above, traders would add the last 30 close prices displayed on the graph then divide that value again by 30.
Due to each moving average using a different period, they will update in varying frequencies. The 30 MVA will be the quickest to react to price, since it is averaging out the fewest number of prices. This is counter to the 100 MVA which as the longest MVA will move the slowest. Traders looking to establish market direction will wait for the both of the shorter term MVA’s to move either above or below the 100 period MVA. If all three averages are heading lower, traders will interpret this as a downtrend and look to sell. If the MVA’s are pointing upward, this will be interpreted as an uptrend and traders will then look to buy that specific currency pair.
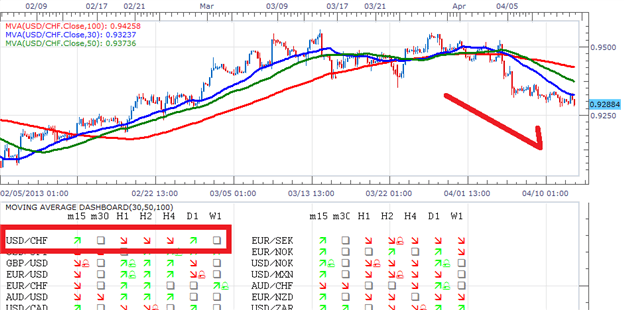
Learn Forex – USDCHF with Dashboard

Moving Average Tools
To help simplify this process, all traders need to do is quickly review the indicator to interpret a series of averages and find the markets strongest trends. The dashboard will display a variety of time frames and currency pairs with either a red or green arrow. A green arrow will only appear if the 30 period MVA is above the 50 period MVA, and the 50 period MVA is above the 100 MVA. This would directly signal to traders that the trend is currently up.
The Dashboard will also display red arrows if the trend is down for a specific currency pair and timeframe. This implies that the 30 period MVA is below the 50 MVA, and that the 50 period MVA is below the 100 MVA. The idea here is for traders to find market direction, and then modify their trading preferences accordingly.


