


The EURGBP as had two strong directional swings so far in 2012. From the January 9th low at .8220 the pair quickly advanced 284 pips to the standing 2012 high at .8504. The tides turned in March with the pair turning and price declining, virtually eliminating previous gains. Currently price is consolidating between support at .8220 and short term resistance holding near .8275.
Next weeks economic calendar has a variety of events that may be the catalyst for a fresh breakout on the EURGBP. On Tuesday, both the Euro Zone and the UK are set to release their most recent consumer pricing data. CPI is a strong indication of growth in an economy and depending on the outcome may cause prices to bounce or break support. As price ranges in anticipation, traders are left with a decision on how to approach the pair. We can set entry orders for a breakout or trade the range.
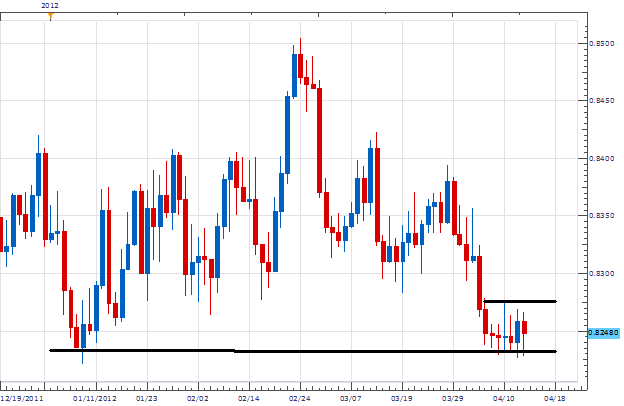
Since this initial triangle break discussed in April 6ths Chart Of The Day, we have been looking for a the EURGBP to move towards printing a lower lows. Lower lows would confirm our downward bias on the pair. Our initial suggestion was to look for a breakout under previous support levels at current 2012 lows. With an entry order below support ,we know that we will only enter the market on a fresh low and avoid entrys on a scenerio if price rises and breaks resistance.
A second method of trading current price action is trading the standing range between support and resistance. As price ranges, we can use a variety of price oscillatiors for our execution trigger. Pictured below you will find the RSI oscillator. Looking to trade with current downward momentum , its recommended to only sell when the indicator turns from an overbought value. This will allow us to have potential entries near resistance over .8275 with stops just above resistance.

My preference is to keep our existing entry on the EURGBP at .8215 with our take profit targets set for a lower low near .8035. Traders will also have the option to trade the range as long as support/resistance holds
Alternative scenarios include price retracing and breaking short term resistance at .8275
---Written by Walker England, Trading Instructor
To contact Walker, email WEngland@FXCM.com . Follow me on Twitter at @WEnglandFX.
To be added to Walker’s e-mail distribution list, send an email with the subject line “Distribution List” to WEngland@FXCM.com .
DailyFX provides forex news on the economic reports and political events that influence the currency market. Learn currency trading with a free practice account and charts from FXCM.


