


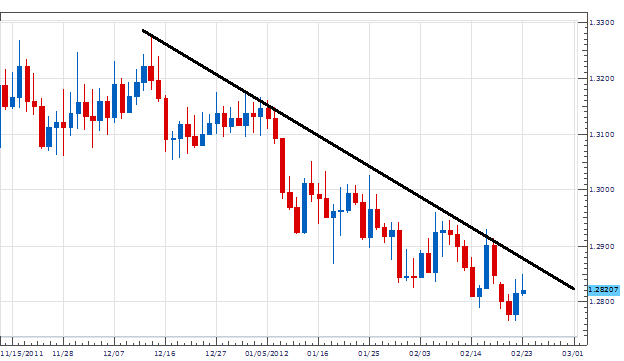
Yesterday, we reviewed the Gartley charting pattern to spot reversals using Fibonacci retracements. Today, these same retracements will be used in conjunction with a trend line for finding entry’s in a strong trending market. The AUD/NZD is a great example as it has moved 512 pips downward from the established December 2011 high at 1.3276.
Our trend line is created by connecting a series of lower highs as we walk down the graph. We begin drawing our trend line by connecting the December high with the January 2nd and February 16th highs. This line forms a point of resistance as prices continue to move lower and will create the basis for our trade idea.
Moving in to a 30 minute chart, we can better see our downward sloping trend line. This will be our first form of resistance as mentioned above. As long as price remains under this line we will maintain our selling bias on the AUD/NZD. With the aid of Fibonacci retracements, we can better spot our entry’s against the trend.
Our Fibonacci retracement should be drawn by moving left to right on our graph. Measurements should begin at the point labeled A on the graph below moving to the most recent low labeled B. The most common retracements should be used in this analysis , 61.8% , 50% , and 38.2% retracements. The key is to extrapolate these Fibonacci retracements and find where they converge with our trend line. This is the optimal point of entry for our strategy.

My preference is to sell the AUD/NZD at resistance found at 1.2865. Stops should be placed above resistance near 1.2900. First limit targets should be set target for a minimum 70 pips profit at 1.2795 to employ a 1:2 Risk / Reward ratio. Secondary targets can look for a new low under 1.2764.
Alternative scenarios include prices breaking higher through resistance.
---Written by Walker England, Trading Instructor
To contact Walker, email instructor@dailyfx.com. Follow me on Twitter at @WEnglandFX.
To be added to Walker’s e-mail distribution list, send an email with the subject line “Distribution List” to instructor@dailyfx.com.
DailyFX provides forex news on the economic reports and political events that influence the currency market. Learn currency trading with a free practice account and charts from FXCM.


