


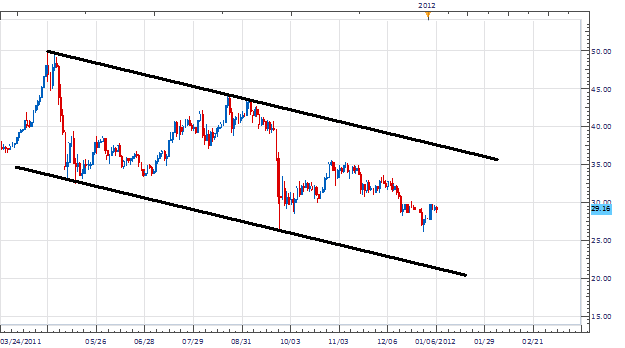
Silver (XAG/USD) has slowly been forming a bearish pricing channel on our daily chart, over the last nine months. Channel support is formed by connecting the 2011 high at $49.87 with the July and September 2011 highs. Support of our channel is formed by connecting the May 2011 low at $32.37 to the September low of $26.13. As price now travels between these two levels, it is an opportune time to move to smaller term charts for further direction.
Divergence is a handy trading tool that compares price action, to an oscillator. Today, we will be looking at the XAG/USD 8hr chart and MACD with traditional 12,26,9 settings. The first step of spotting divergence is to spot the trend. In our chart below, we can see our downtrend continue, as lower lows are being created on the graph. Visually, we can see this by drawing a trend line connecting the higher lows being formed on our charts.
Next, we need to view MACD by utilizing the same steps above. We can connect out high points on the indicator for the same time duration that we viewed our price chart. Indicators by nature are lagging and will traverse a chart in the same manner as price. Divergence is spotted however, when price and an indicator take two different paths.
Below is an example of indicator divergence hidden inside of the trend. With price pointing downward under our trend line, but the indicator making a new high, we should appraise this as an opportunity to enter the established trend. The indicator essentially is acting as a spring board, loading up to a new high before rejoining price in creating a new low. Traders may even proceed to enter their trade on an oscillator crossover.

My preference is to sell entries Silver on a MACD crossover near $29.00. Stops should be set over resistance at $30.00. Primary profit targets may be set at $27.00, for a clear 1-2 risk reward ratio. Secondary targets may be set near our daily channel support line, at $21.40
Alternative scenarios include price breaking higher over short term resistance towards our channel line.
---Written by Walker England, Trading Instructor
To contact Walker, email instructor@dailyfx.com. Follow me on Twitter at @WEnglandFX.
To be added to Walker’s e-mail distribution list, send an email with the subject line “Distribution List” to instructor@dailyfx.com.
DailyFX provides forex news on the economic reports and political events that influence the currency market. Learn currency trading with a free practice account and charts from FXCM.


